Bottom homepage
Dirt
WTC & Hutch (JJ)
Erin & Field (erin)
Billiard Balls
Qui Tam Case
Why Indeed
Index Erin1 Erin2
Erin3
Erin4 Erin5 Erin6 Erin7 Erin8 Erin9 Erin10
Appendix_1 Appendix_2 Appendix_3


9/11 Weather Anomalies and Field Effects
(page 2)

by

Judy Wood

This page last updated, May 19, 2008

click on images for enlargements.

This page is currently UNDER CONSTRUCTION.

(originally posted: March 25, 2008)
Hurricane Erin, September 11, 2001
Figure 1. Hurricane Erin looks at NYC on 9/11/01 without being noticed???
(9/11/01) Source:, (9/11/01) Original Image: (more)

Figure 2. Hurricane Erin, September 10, 2001
Source: webpage:
Figure 3. Hurricane Katrina, August 29, 2005
Source: webpage:


Figure 4. Erin looks in on NYC on 9/11/01
(9/11/01) Source:
Figure 5. Erin looks in on NYC on 9/11/01
(9/11/01) Source:

click on images for enlargements.

Figure 6. Erin looks in on NYC on 9/11/01
(9/11/01) Source:
Figure 7. Erin looks in on NYC on 9/11/01
(9/11/01) Source:
Figure 8. Erin looks in on NYC on 9/11/01
(9/11/01) Source:
Figure 9. Erin looks in on NYC on 9/11/01
(9/11/01) Source:

Figure 10. Erin looks in on NYC on 9/11/01
(9/11/01) Source: 010911_wtc_terra1_cbc.jpg
Figure 11. 9/11 world trade center footage from space station
(2:25)(9/11/01) URL:


Hurricane Erin 2001 Top
Source: http://www.nhc.noaa.gov/2001erin.html with additional comparisons added, comparing Erin with Katrina.

Tropical Cyclone Report
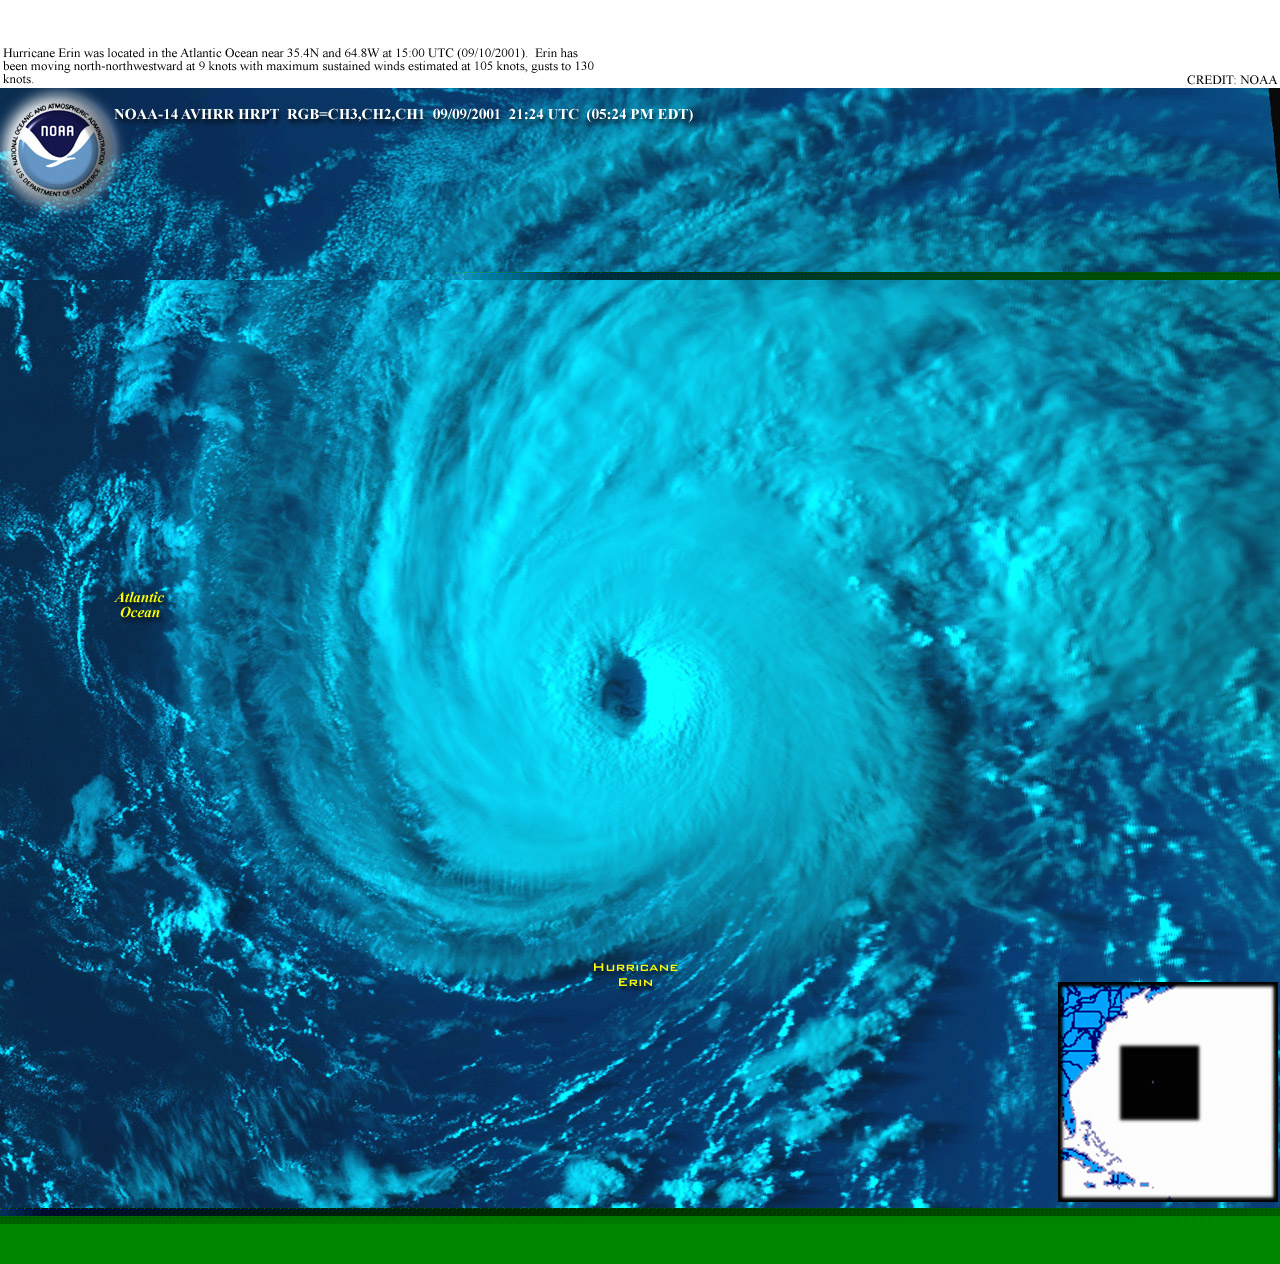
Hurricane Erin

1 - 15 September 2001

Richard J. Pasch and Daniel P. Brown
National Hurricane Center
20 November 2001
Revised: 25 January 2002

Erin was the third of a series of four "interrupted track" tropical cyclones during the 2001 Atlantic hurricane season. After re-forming, it strengthened to a category three hurricane on the Saffir-Simpson Hurricane Scale, just to the east of Bermuda.

a. Synoptic History

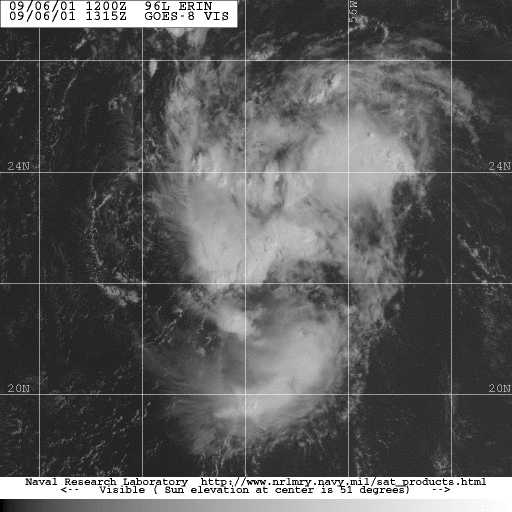
Erin can be traced back to a tropical wave that emerged from western Africa on 30 August. The system almost immediately showed signs of tropical cyclone formation, with curvature in the bands of associated deep convection. Dvorak classifications commenced at 1800 UTC on the 30th. There was little change in the system's organization, and deep convection was sporadic for the next day or so. On 1 September the cloud pattern began to become better organized, and based on the satellite presentation as well as drifting buoy data that showed a definite closed surface circulation, it is estimated that a tropical depression formed by 1800 UTC that day, located about 600 n mi west-southwest of the Cape Verde Islands. With a mid-tropospheric ridge in place to its north, the tropical cyclone moved on a west to west-northwestward heading at 14-18 kt over the following three days.

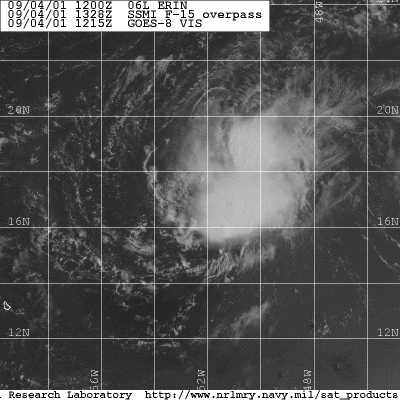
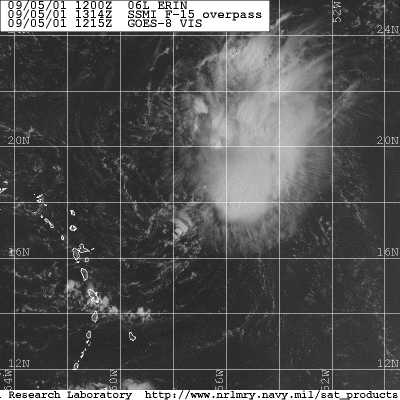
At first, there was weak to moderate vertical shear over the area, and the cyclone was able to strengthen into Tropical Storm Erin by 0600 UTC 2 September. Erin's maximum winds increased to near 50 knots by 0600 UTC 3 September. Later on the 3rd, vertical shear associated with an upper-level low to the northwest caused the low-level center of the storm to become exposed to the southwest of the main area of deep convection, indicating that Erin had weakened. On the 4th, the shear appeared to lessen somewhat, and Erin re-strengthened slightly. However the system failed to become much better organized, and was soon on a weakening trend. By 5 September, southwesterly shear caused the tropical cyclone to degenerate into an area of disturbed weather.

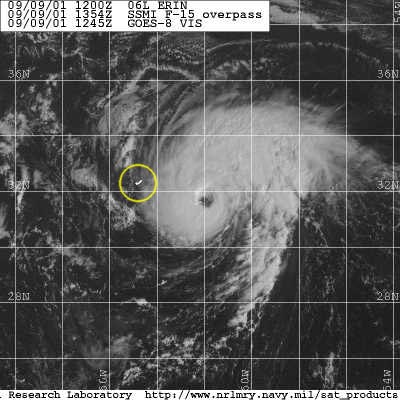
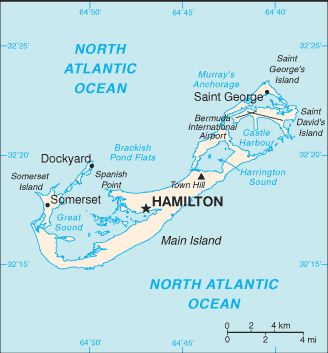
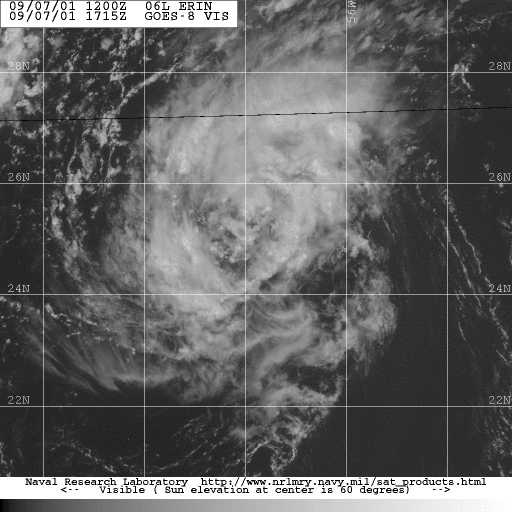
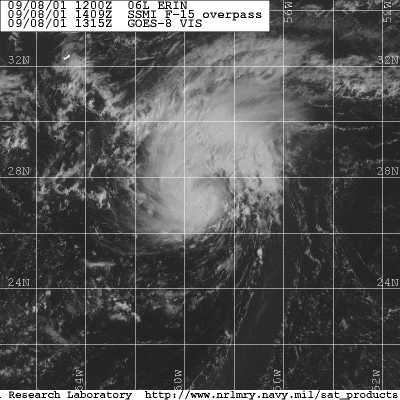
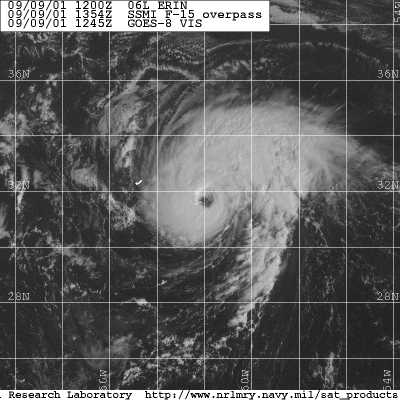
About a day later, a surface circulation re-developed in the northern part of the area of disturbed weather that was associated with Erin. The re-generated tropical depression moved north-northeastward, then north-northwestward, and regained tropical storm strength about 550 n mi north-northeast of the northern Leeward Islands at 1800 UTC 7 September. After a mid-level ridge to the north of Erin was temporarily weakened by a passing trough, the ridge re-built, moving the storm toward the northwest and north-northwest. Erin strengthened into a hurricane late on the 8th. While passing east of Bermuda on the 9th, Erin continued to strengthen, and it reached its peak intensity of 105 kt around 1800 UTC that day. A few hours later, the eye of the hurricane passed within about 90 n mi east-northeast of Bermuda, which was Erin's point of closest approach to the island.

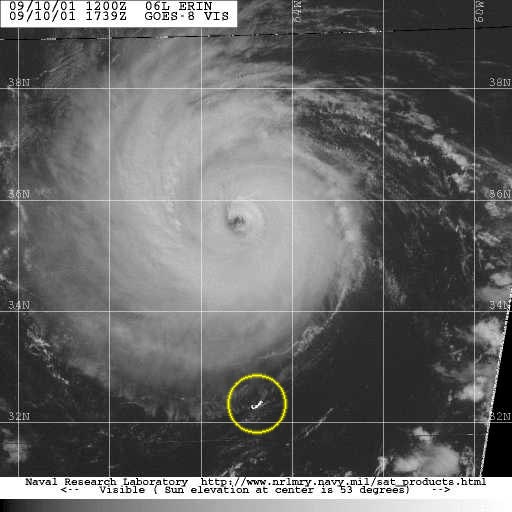
After brushing Bermuda, the hurricane continued to move mainly toward the north-northwest. On 10 September, Erin began to weaken, however the weakening was slower than usual over the ensuing days, due in part to slightly warmer than normal waters over the western subtropical Atlantic. A series of short-wave troughs weakened the western portion of the Atlantic subtropical ridge. This caused the motion of the hurricane to turn toward the right, with a decrease in forward speed, on the 11th. Erin's heading veered toward the east-northeast and east on the 12th. Then, a broad, amplifying mid- to upper-level trough over eastern Canada accelerated Erin toward the northeast. The center passed just east of Cape Race, Newfoundland at 0000 UTC, while the system was weakening to just below hurricane strength. Then, Erin lost its tropical characteristics. The extratropical storm accelerated north-northeastward and passed over southern Greenland on 16 September, and merged with high-latitude cyclonic flow over eastern Greenland on the 17th.

b. Meteorological Statistics

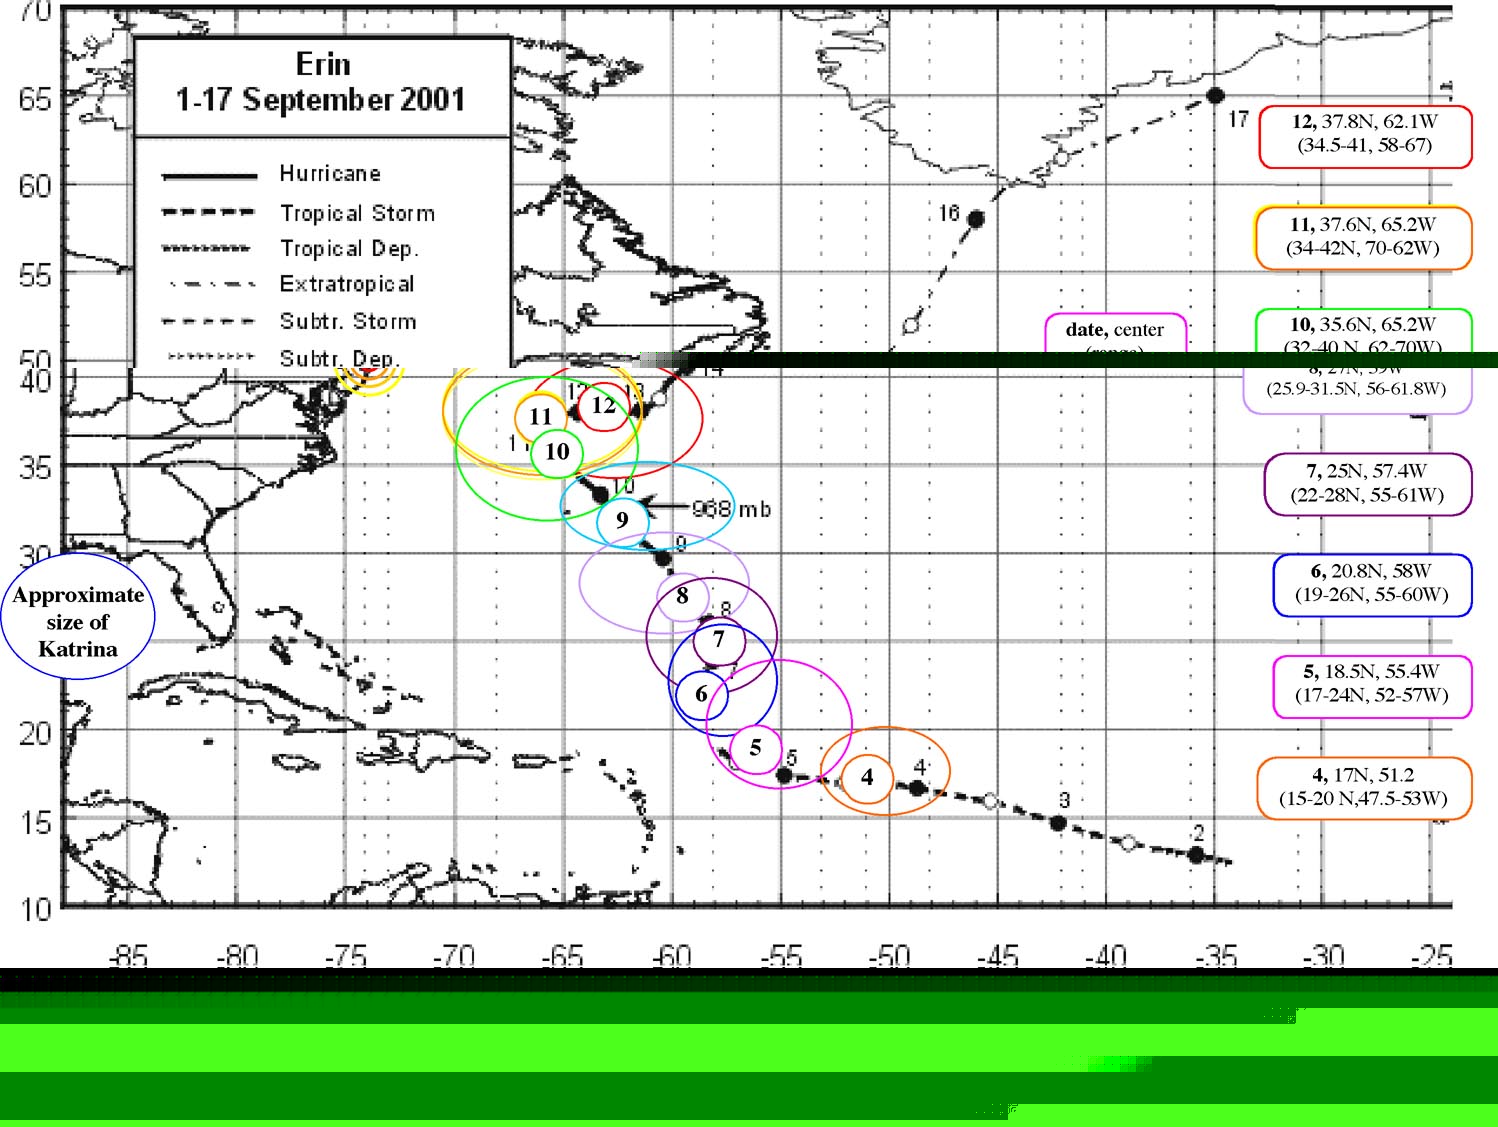
The "best track" map of Erin's path is given in Figure 1, and the best track positions and intensities are listed in Table 1. Time series of the wind and pressure histories of Erin are shown in Figure 2 and Figure 3, respectively. Observations in these figures include satellite-based Dvorak technique intensity estimates from the Tropical Analysis and Forecast Branch (TAFB), the Satellite Analysis Branch (SAB) and the U. S. Air Force Weather Agency (AFWA), as well as flight-level and dropwindsonde observations from flights of the 53rd Weather Reconnaissance Squadron of the U. S. Air Force Reserve Command.

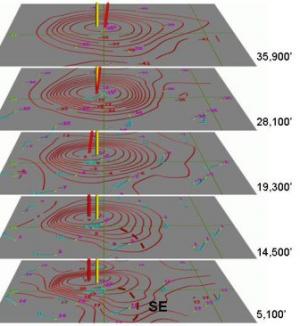
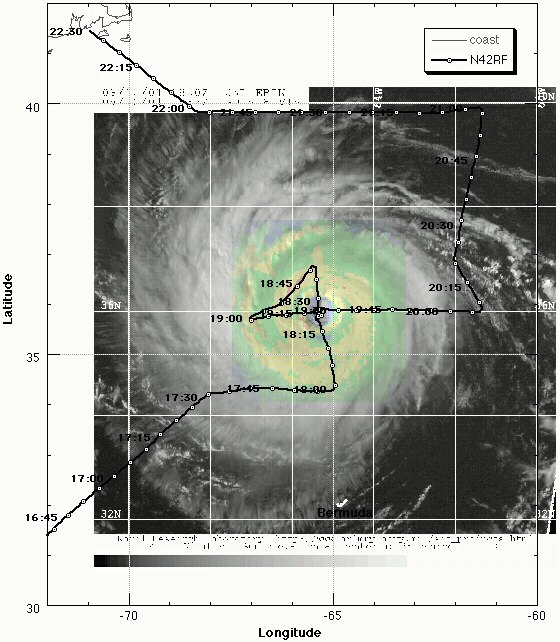
Erin's peak intensity of 105 kt at 1800 UTC 9 September is a compromise of the following observations taken around that time: 90 percent of the maximum flight-level (700 mb) winds of 118 kt (106 kt); the surface reduction of the lowest 150 m of a dropwindsonde sounding, yielding 97 kt; and a surface value from that same sounding of 111 kt. Although the minimum central pressure value of 968 mb around the time of peak intensity would not typically support quite so high a wind speed, Erin was situated in an area of higher than average (for a tropical cyclone) environmental pressures. About 24 h after peak intensity, during 1900-2000 UTC 10 September, radar data and Stepped-Frequency Microwave Radiometer measurements from a NOAA aircraft showed that Erin had a concentric eyewall structure.

Bermuda reported a peak wind gust of 36 kt at 2300 UTC 9 September, about when the center of Erin was nearest to that island. Cape Race, Newfoundland reported sustained winds of 38 kt with a gust to 46 kt at 2100 UTC 14 September, and a sustained wind of 46 kt with a gust to 58 kt at 0200 UTC 15 September. St. John's, Newfoundland reported a gust to 45 kt at 0352 UTC. Grates Cove, Newfoundland reported a gust to 56 kt at 0449 UTC 15 September, and Bonavista Newfoundland reported sustained winds of 34 kt with a gust to 58 kt at 0536 UTC 15 September. Note that the observations after 0000 UTC 15 September occurred during the extratropical stage of Erin. Maximum rainfall totals from Newfoundland were 131 mm (5.1 in) at Sagona Island, 102 mm (4.0 in) at Burgeo, and 78 mm (3.1 in) at Bonavista.

Ship and buoy reports of winds of tropical storm force associated with Erin are listed in Table 2. There were a couple of drifting buoy observations of hurricane force winds near the tropical cyclone, at 0000 and 0300 UTC 4 September, which have been excluded because they were not consistent with nearby observations in time and/or space (the best track intensity was 40-45 kt around these times).

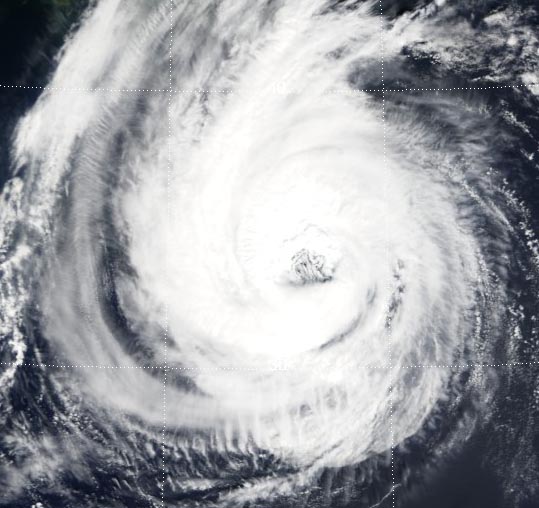
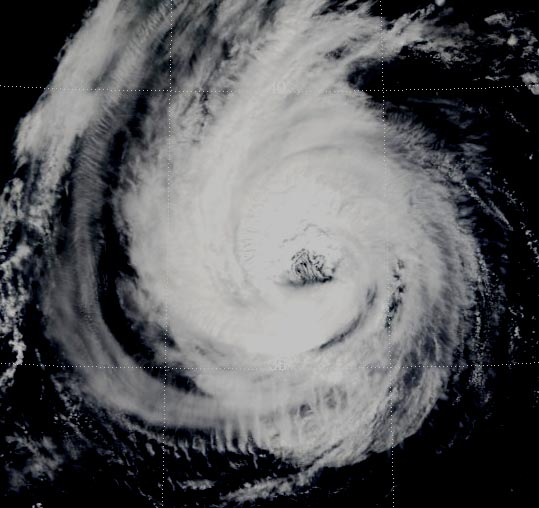
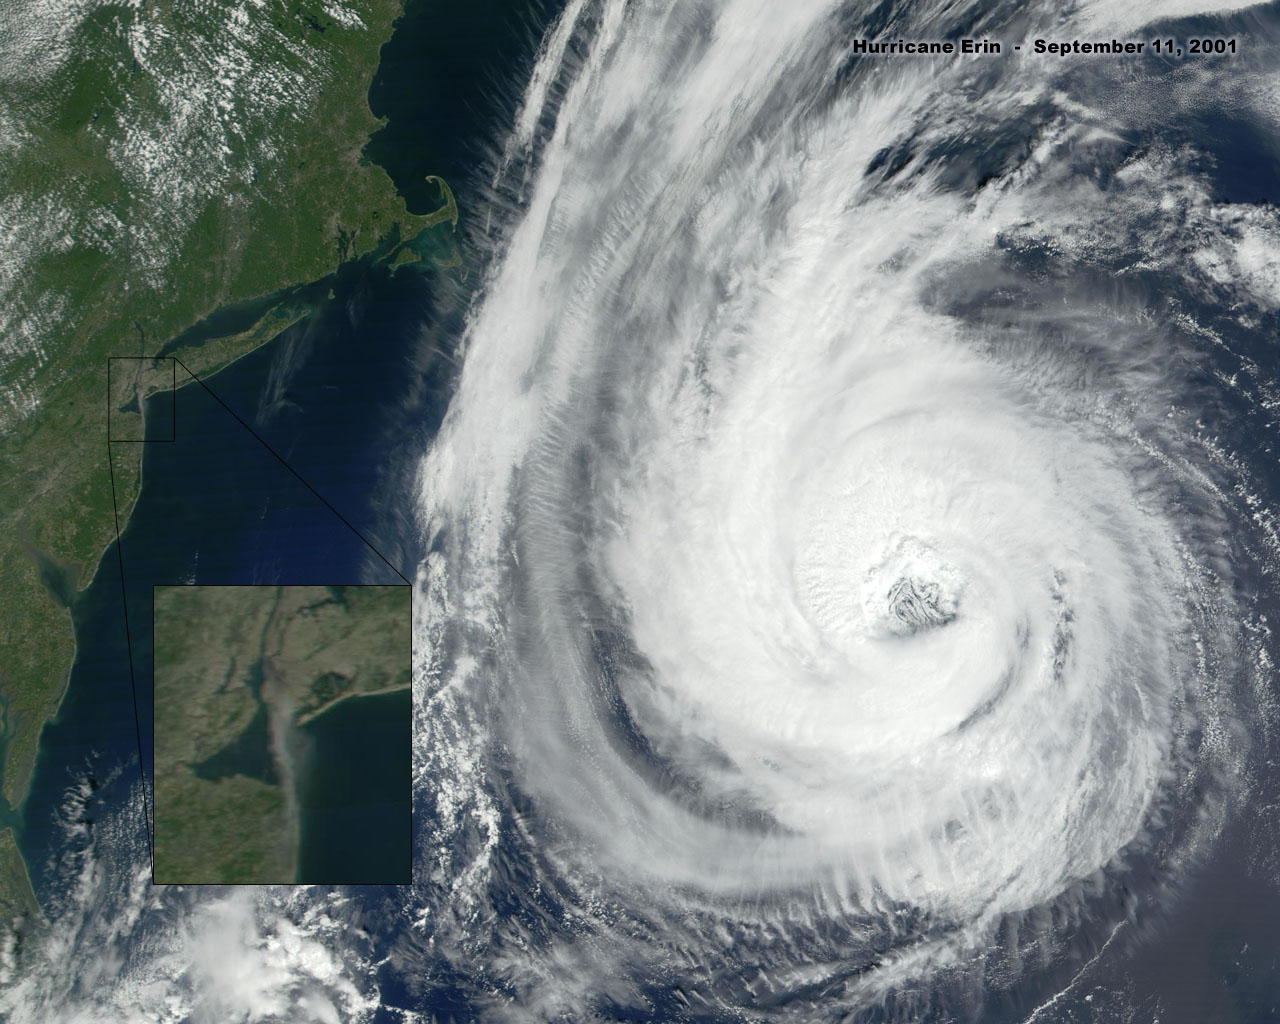
Figure 4 is a striking, high-resolution (250 m) visible image of the inner core of Erin just before its peak intensity, taken with the Moderate Resolution Imaging Spectroradiometer (MODIS) onboard the polar-orbiting NASA Terra satellite. Note the presence of two distinct vortices inside the eye. Such features have been observed before in intense hurricanes.

c. Casualty and Damage Statistics

There were no reports of damage or casualties associated with Erin.

d. Forecast and Warning Critique

Table 3 lists the average track forecast errors for Erin, for selected numerical guidance models and the official forecasts. It can be seen that the average official track forecasts for this tropical cyclone were better than the most recent ten-year averages at all forecast times. However, the AVNI and GFDI model forecasts had even lower average errors at almost all forecast times, especially at 72 h.

Average absolute official intensity errors were 5, 10, 15, 16, and 11 kt for the 12, 24, 36, 48, and 72 h forecasts, respectively. For comparison, the average official intensity errors over the 10-yr period of 1991-2000 are 7, 11, 14, 16, and 20 kt, respectively. So, the average NHC intensity forecasts for Erin were about the same as the long-term averages for 12 through 48 h, and somewhat better than average at 72 h. In general, Erin's strength was over-predicted during the first few days of its existence. In particular, the NHC forecasts never anticipated that the system was going to dissipate in the deep tropics. After Erin's re-formation, the NHC intensity forecasts were mostly under-predictions, and strengthening to a major hurricane was not forecast until just 12 h before it happened. For comparison, the average absolute errors of the SHIPS model intensity forecasts for Erin were 7, 11, 16, 20, and 24 kt.

Table 4 lists the watches and warnings associated with Erin. The government of Bermuda issued a hurricane watch 30 h before Erin's closest point of approach, and a hurricane warning 24 h before the closest point of approach to the island.

e. Acknowledgments

The high-resolution MODIS image of Erin was provided by Liam Gumley of the Space Science and Engineering Center of the University of Wisconsin-Madison. MODIS data acquired by direct broadcast from the NASA Terra spacecraft at the Space Science and Engineering Center, University of Wisconsin-Madison. Paul Vukits of the NOAA Marine Prediction Center provided analyses and high seas forecasts that were used to produce the extratropical portion of the best track.

Reference 1.
Source: http://www.nhc.noaa.gov/2001erin.html


Hurricane Erin
Hurricane Katrina
Date/Time
(UTC)
Position
Pressure (mb)
Wind Speed (kt)
Stage
Saffir-Simpson Scale (added)
Lat. (°N)
Lon. (°W)
01 / 1800 12.5 34.3
1006
30
tropical depression
TD
02 / 0000 12.9 35.9
1005
30
"
TD
02 / 0600 13.2 37.5
1002
40
tropical storm
TS
02 / 1200 13.5 39.0
1003
45
"
TS
02 / 1800 14.1 40.6
1003
45
"
TS
03 / 0000 14.7 42.2
1003
45
"
TS
03 / 0600 15.3 43.7
1003
50
"
TS
03 / 1200 15.9 45.3
1003
50
"
TS
03 / 1800 16.3 47.1
1002
40
"
TS
04 / 0000 16.7 48.7
1002
40
"
TS
04 / 0600 17.0 50.3
1000
45
"
TS
04 / 1200 17.0 52.0
1000
45
"
TS
04 / 1800 17.2 53.4
1000
45
"
TS
05 / 0000 17.4 54.8
1000
45
"
TS
05 / 0600 17.8 55.9
1000
45
"
TS
05 / 1200 18.1 57.0
1013
35
"
TS
05 / 1800 19.0 57.9
1014
25
low pressure area
-
06 / 0000 20.1 58.1
1015
15
"
-
06 / 0600 21.2 58.2
1015
15
"
-
06 / 1200 22.2 58.3
1014
20
"
-
06 / 1800 23.2 58.4
1013
25
re-formed td
TD
07 / 0000 23.9 58.1
1012
25
"
TD
07 / 0600 24.4 57.6
1008
30
"
TD
07 / 1200 24.9 57.8
1008
30
"
TD
07 / 1800 25.3 58.0
1005
35
tropical storm
TS
08 / 0000 26.0 58.3
1004
35
"
TS
08 / 0600 26.5 58.8
999
40
"
TS
08 / 1200 27.2 59.2
999
45
"
TS
08 / 1800 28.4 59.8
994
60
"
TS
09 / 0000 29.7 60.4
987
75
hurricane
1
09 / 0600 30.6 61.3
982
90
"
2
09 / 1200 31.5 62.2
979
95
"
2
09 / 1800 32.4 62.8
968
105
"
3
10 / 0000 33.3 63.3
969
105
"
3
10 / 0600 34.2 64.1
969
105
"
3
10 / 1200 34.9 64.7
969
100
"
3
10 / 1800 35.7 65.4
970
90
"
2
11 / 0000 36.4 65.7
973
80
"
1
11 / 0600 36.9 65.9
976
80
"
1
11 / 1200 37.4 65.6
976
80
"
1
11 / 1800 37.8 65.1
976
80
"
1
12 / 0000 38.0 64.3
976
80
"
1
12 / 0600 38.0 63.3
979
75
"
1
12 / 1200 37.9 62.6
979
75
"
1
12 / 1800 37.9 62.0
979
75
"
1
13 / 0000 38.1 61.4
979
75
"
1
13 / 0600 38.3 61.0
982
70
"
1
13 / 1200 38.8 60.6
982
70
"
1
13 / 1800 39.6 60.2
982
70
"
1
14 / 0000 40.6 59.3
982
70
"
1
14 / 0600 42.0 58.1
987
65
"
1
14 / 1200 43.3 56.7
987
65
"
1
14 / 1800 44.7 55.2
984
65
"
1
15 / 0000 46.7 52.7
981
60
tropical storm
TS
15 / 0600 49.0 51.0
981
60
extratropical
TS
15 / 1200 52.0 49.0
978
55
"
TS
15 / 1800 55.0 47.5
976
55
"
TS
16 / 0000 58.0 46.0
972
55
"
TS
16 / 0600 60.0 44.5
976
55
"
TS
16 / 1200 61.5 42.0
981
55
"
TS
16 / 1800 63.0 38.9
985
50
"
TS
17 / 0000 65.0 35.0
995
40
"
TS
17 / 0600    
 
 
merged
 

09 / 1800 32.4 62.8
968
105
minimum pressure
 

TD TS H1 H2 H3 H4 H5
TD
TS
1
2
3
4
5
SAFFIR - SIMPSON SCALE
Type
CG
Winds
(mph)
Winds
(knots)
Pressure
(millibars)
Surge
(feet)
Tropical
Depression
TD
< 39
< 34
Tropical
Storm
TS
39 - 73
34 - 63
Hurricane
1
74 - 95
64 - 82
> 980
4 - 5
Hurricane
2
96 - 110
83 - 95
965 - 980
6 - 8
Hurricane
3
111 - 130
96 - 113
945 - 965
9 - 12
Hurricane
4
131 - 155
114 - 135
920 - 945
13 - 18
Hurricane
5
> 155
> 135
< 920
> 18
Figure A. Saffir-Simpson Scale
Derived from: Source: webpage:


TD TS H1 H2 H3 H4 H5
TD
TS
1
2
3
4
5

Date/Time (UTC)
Position
Pressure (mb)
Wind Speed (kt)
Stage
Saffir-
Simpson
Scale
(added)
Lat. (°N)
Lon. (°W)
23 / 1800 23.1 75.1 1008 30
tropical depression
TD
24 / 0000 23.4 75.7 1007 30
"
TD
24 / 0600 23.8 76.2 1007 30
"
TD
24 / 1200 24.5 76.5 1006 35
tropical storm
TS
24 / 1800 25.4 76.9 1003 40
"
TS
25 / 0000 26.0 77.7 1000 45
"
TS
25 / 0600 26.1 78.4 997 50
"
TS
25 / 1200 26.2 79.0 994 55
"
TS
25 / 1800 26.2 79.6 988 60
"
TS
26 / 0000 25.9 80.3 983 70
hurricane
1
26 / 0600 25.4 81.3 987 65
"
1
26 / 1200 25.1 82.0 979 75
"
1
26 / 1800 24.9 82.6 968 85
"
2
27 / 0000 24.6 83.3 959 90
"
2
27 / 0600 24.4 84.0 950 95
"
2
27 / 1200 24.4 84.7 942 100
"
3
27 / 1800 24.5 85.3 948 100
"
3
28 / 0000 24.8 85.9 941 100
"
3
28 / 0600 25.2 86.7 930 125
"
4
28 / 1200 25.7 87.7 909 145
"
5
28 / 1800 26.3 88.6 902 150
"
5
29 / 0000 27.2 89.2 905 140
"
5
29 / 0600 28.2 89.6 913 125
"
4
29 / 1200 29.5 89.6 923 110
"
3
29 / 1800 31.1 89.6 948 80
"
1
30 / 0000 32.6 89.1 961 50
tropical storm
TS
30 / 0600 34.1 88.6 978 40
"
TS
30 / 1200 35.6 88.0 985 30
tropical depression
TD
30 / 1800 37.0 87.0 990 30
"
TD
31 / 0000 38.6 85.3 994 30
extratropical
TD
31 / 0600 40.1 82.9 996 25
"
TD
31 / 1200        
merged with front

28 / 1800 26.3 88.6 902 150
Maximum wind and minimum pressure
25 / 2230 26.0 80.1 984 70
FL landfall at Broward-Miami-Dade County line
29 / 1110 29.3 89.6 920 110
Landfall near Buras, LA
29 / 1445 30.2 89.6 928 105
Landfall near LA/MS border
(Original table from source with added column.) (Original table from source with added column.)
(Table 1): Best track for Hurricane Erin, 1 - 15 September 2001. (return to article)(return to unprecidented article)
Source:
Table 1a: Best track for Hurricane Katrina, 23 - 30 August 2005.
Source: (doc)(pdf)

click on images for enlargements.


Ship Name or Call Sign Date/Time (UTC) Lat. (°N) Lon. (°W) Wind dir/speed (deg/kt) Pressure (mb)
Date/Time (UTC)
Lat. (°N) Lon. (°W)
Pressure (mb)
Wind Speed (kt) from Table 1.
41559 4/0000 17.2 48.9 060/39  1009.4  04 / 0000 16.7 48.7
1002
40
41559 4/0200 17.2 48.9 090/41  1009.0  04 / 0600 17.0 50.3
1000
45
41559 4/0400 17.2 48.9 120/37  1010.3  04 / 1200 17.0 52.0
1000
45
41559 4/0900 17.2 48.9 140/35  1010.8  04 / 1800 17.2 53.4
1000
45
8POI 9/1800 32.5 59.7 140/34  1017.3  09 / 1200 31.5 62.2
979
95
PCUI 9/1800 32 65 /35  09 / 1800 32.4 62.8
968
105
10/
(no data)
10/
(no data)
11/
(no data)
11/
(no data)
WDA367 12/1200 36.3 64.8 340/35  1008.0  12 / 0600 38.0 63.3
979
75
WDA367 12/1500 36.2 63.7 310/35  1006.0  12 / 1200 37.9 62.6
979
75
WDA367 12/1800 36.0 62.7 270/37  1004.0  12 / 1800 37.9 62.0
979
75
WDA367 13/0000 36.1 60.6 230/43  1004.0  13 / 0000 38.1 61.4
979
75
WGMJ 13/0000 36.4 65.7 360/34  1010.8  13 / 0600 38.3 61.0
982
70
WDA367 14/0000 39.1 52.5 120/35  1016.0  13 / 1800 39.6 60.2
982
70
WGMJ 14/0000 36 66 /35  14 / 0000 40.6 59.3
982
70
UCTR 14/1500 43.2 51.7 230/48  1006.0  14 / 0600 42.0 58.1
987
65
(Original table from source with gray lines added to highlight missing data. Columns to the right have been added for comparison with Table 1 data.)

Figure 12.
17N, 51.2
(15-20 N,47.5-53W)
(9/04/01) Source:

(1.81, 1.56)

(271.5, 234)
(217, 187)

Figure 13.
31.7N, 62W
(30-35 N, 57-65 W)
(9/09/01) Source:

(1.81, 1.69)

(271.5, 253.5)
(217, 203)

Figure 14.
37.8N, 62.1W
(34.5-41, 58-67)
(9/12/01) Source:

(1.15, 1.15)

(172.5, 172.5)
(138, 138)

(Table 2): Selected ship observations of tropical storm or greater winds associated with Hurricane Erin, 1 - 15 September 2001. (return to article)
Source:


Forecast (all values) Hurricane Erin

Forecast Technique
Period (hours) for Hurricane Erin
12 24 36 48 72
CLIP
44 (40)
102 (36)
162 (32)
224 (28)
401 (24)
GFDI
32 (39)
53 (35)
71 (31)
87 (27)
169 (23)
LBAR
40 (40)
82 (36)
137 (32)
200 (28)
346 (24)
AVNI
31 (34)
53 (30)
71 (26)
87 (22)
165 (22)
BAMD
41 (40)
74 (36)
114 (32)
160 (28)
262 (24)
BAMM
36 (40)
67 (36)
90 (32)
102 (28)
191 (24)
BAMS
44 (40)
87 (36)
123 (32)
160 (28)
273 (24)
NGPI
40 (38)
65 (34)
100 (30)
119 (26)
219 (22)
UKMI
38 (37)
81 (33)
141 (29)
208 (25)
353 (22)
GUNS
28 (35)
50 (31)
74 (27)
96 (23)
193 (20)
NHC Official
32 (40)
60 (36)
80 (32)
96 (28)
183 (24)
NHC Official
(1991-2000 mean)
44 (2049)
82 (1835)
118 (1646)
151 (1475)
226 (1187)
*Output from these models was unavailable at time of forecast issuance.
TD TS H1 H2 H3 H4 H5
TD
TS
1
2
3
4
5
SAFFIR - SIMPSON SCALE
Type
CG
Winds
(mph)
Winds
(knots)
Pressure
(millibars)
Surge
(feet)
Tropical
Depression
TD
< 39
< 34
Tropical
Storm
TS
39 - 73
34 - 63
Hurricane
1
74 - 95
64 - 82
> 980
4 - 5
Hurricane
2
96 - 110
83 - 95
965 - 980
6 - 8
Hurricane
3
111 - 130
96 - 113
945 - 965
9 - 12
Hurricane
4
131 - 155
114 - 135
920 - 945
13 - 18
Hurricane
5
> 155
> 135
< 920
> 18
Figure A. Saffir-Simpson Scale
Derived from: Source: webpage:
(Original table from source.)
(Table 3): Preliminary forecast evaluation (heterogeneous sample) for Hurricane Erin, 1-15 September 2001. Forecast errors for tropical storm and hurricane stages (n mi) are followed by the number of forecasts in parentheses. Errors smaller than the NHC official forecast are shown in bold-face type. (return to article)
Source:


TD TS H1 H2 H3 H4 H5
TD
TS
1
2
3
4
5
Forecast comparison, Erin & Katrina
Forecast
Technique
Period (hours) for Hurricane Erin
Forecast
Technique
Forecast Period (hours) for Hurricane Katrina
12
24
36
48
72
12
24
36
48
72


CLIP
44 (40)
102 (36)
162 (32)
224 (28)
401 (24)
CLP5
35 (27)
81 (25)
148 (23)
222 (21)
379 (17)
GFDI
32 (39)
53 (35)
71 (31)
87 (27)
169 (23)
GFDI
31 (27)
55 (25)
75 (23)
97 (21)
147 (17)
BAMD
41 (40)
74 (36)
114 (32)
160 (28)
262 (24)
BAMD
26 (27)
45 (25)
65 (23)
86 (21)
111 (17)
BAMM
36 (40)
67 (36)
90 (32)
102 (28)
191 (24)
BAMM
31 (27)
61 (25)
86 (23)
108 (21)
143 (17)
BAMS
44 (40)
87 (36)
123 (32)
160 (28)
273 (24)
BAMS
59 (25)
109 (23)
138 (21)
158 (19)
185 (16)
NGPI
40 (38)
65 (34)
100 (30)
119 (26)
219 (22)
NGPI
27 (27)
48 (25)
72 (23)
96 (21)
161 (17)
UKMI
38 (37)
81 (33)
141 (29)
208 (25)
353 (22)
UKMI
21 (23)
33 (22)
53 (21)
85 (19)
154 (15)
GUNS
28 (35)
50 (31)
74 (27)
96 (23)
193 (20)
GUNA
21 (23)
38 (22)
57 (21)
84 (19)
156 (15)
NHC Official
32 (40)
60 (36)
80 (32)
96 (28)
183 (24)
OFCL
24 (27)
42 (25)
64 (23)
96 (21)
174 (17)
NHC Official
(1991-2000 mean)
44
(2049)
82
(1835)
118
(1646)
151
(1475)
226
(1187)
NHC Official
(1995-2004 mean)
42
(3400)
75
(3116)
107
(2848)
138
(2575)
202
(2117)
The underlined values are the only values in this table for which Katrina was predicted to be stronger than Erin.
53 (35)
The underlined values are the only values in this table for which Katrina was predicted to be stronger than Erin.
55 (25)
(This table has been cut from original.) (This table has been cut from original.)
Table A: Preliminary forecast evaluation (heterogeneous sample) for Hurricane Erin, 1-15 September 2001. Forecast errors for tropical storm and hurricane stages (n mi) are followed by the number of forecasts in parentheses. Errors smaller than the NHC official forecast are shown in bold-face type.
Source:
Table B:

Source: (doc)(pdf)


Figure 15. Track of Hurricane Erin.
(9/01-17/01) Source:


Forecast comparison (all values), Erin & Katrina (see Appendix2 )


click on images for enlargements.


Bermuda


Figure 16a. The yellow circle shows the location of Bermuda, as Hurricane Erin passes by.
31.7N, 62W
(30-35 N, 57-65 W)
(9/09/01) Source:
(1.81, 1.69)(362, 338)(377, 351)
Figure 16b. The yellow circle shows the location of Bermuda, as Hurricane Erin passes by.
35.6N, 65.2W
(32-40 N, 62-70W)
(9/10/01) Source:
(1.15, 1.13)(230, 226)

Best track positions for Hurricane Erin, September 2001.
Figure 17. photo source:
TD TS H1 H2 H3 H4 H5
TD
TS
1
2
3
4
5
Best track positions for Hurricane Erin, September 2001.
Figure 18. Hamilton, Bermuda is 32°18 N, 64°47 W
Info source: photo source:

Date/Time
(UTC)
Position
Pressure (mb)
Wind Speed (kt)
Stage
Saffir-Simpson Scale (added)
Lat. (°N)
Lon. (°W)
08 / 0000 26.0 58.3
1004
35
tropical storm
TS
08 / 0600 26.5 58.8
999
40
"
TS
08 / 1200 27.2 59.2
999
45
"
TS
08 / 1800 28.4 59.8
994
60
"
TS
09 / 0000 29.7 60.4
987
75
hurricane
1
09 / 0600 30.6 61.3
982
90
"
2
09 / 1200 31.5 62.2
979
95
"
2
09 / 1800 32.4 62.8
968
105
"
3
10 / 0000 33.3 63.3
969
105
"
3
10 / 0600 34.2 64.1
969
105
"
3
10 / 1200 34.9 64.7
969
100
"
3
10 / 1800 35.7 65.4
970
90
"
2

Date/Time

Action

Location

8/1500

Hurricane watch issued

Bermuda 

8/2100

Hurricane watch replaced by hurricane warning

Bermuda 

9/2100

Hurricane warning changed to tropical storm warning

Bermuda 

10/1500

Tropical storm warning discontinued

Bermuda 

(Original table from source with color added.) (Segment from Table 1, original source .)
(Table 4): Watch and warning summary, Hurricane Erin, 1 - 15 September 2001. (return to article)
Source:
Table 1x: Segment from Table 1, Best track for Hurricane Erin, 1 - 15 September 2001.
Source:
Bermuda had a hurricane watch and hurricane warning on 9/8/01, when Erin was listed as a tropical storm. Then, when Erin was upgraded to hurricane status, the hurricane warning was changed to a tropical storm warning. This change was issued just after Erin was upgraded to a category 3 hurricane.

click on images for enlargements.


Best track positions for Hurricane Erin, September 2001.

Hurricane location
September, 2001
11
10
9
8
7
6
Best track positions for Hurricane Erin, September 2001.
(Original figure from source.)
Figure 19. (Figure 1): Best track for Hurricane Erin, September 2001. Track during the extratropical stage is based on analyses from the NOAA Marine Prediction Center. (return to article)
Source:
Figure 20: Best track for Hurricane Erin, September 2001. Track during the extratropical stage is based on analyses from the NOAA Marine Prediction Center.
Map source:


Best track maximum sustained surface wind speed curve for Hurricane Erin

Best track minimum central pressure curve for Hurricane Erin
(Original figure from source.) (Original figure from source.)
Figure 21. (Figure 2): Best track maximum sustained surface wind speed curve for Hurricane Erin, September 2001, and the observations on which the best track curve is based. Aircraft observations have been adjusted for elevation using 90%, 80%, and 80% reduction factors for observations from 700 mb, 850 mb, and 1500 ft, respectively. Dropwindsonde observations include actual 10 m winds (sfc), as well as surface estimates derived from the mean wind over the lowest 150 m of the wind sounding (LLM), and from the sounding boundary layer mean (MBL). Estimates during the extratropical stage are based on analyses from the NOAA Marine Prediction Center. (return to article)
Source:
Figure 22. (Figure 3): Best track minimum central pressure curve for Hurricane Erin, September 2001, and the observations on which the best track curve are based. Estimates during the extratropical stage are based on analyses from the NOAA Marine Prediction Center. (return to article)
Source:


The eye Top

Moderate Resolution Imaging Spectroradiometer (0.66 microns) image of the inner core of Hurricane Erin
(Original figure from source.)
Figure 23. (Figure 4): Moderate Resolution Imaging Spectroradiometer (0.66 microns) image of the inner core of Hurricane Erin, from the Terra (Earth Observing System AM-1) polar-orbiting satellite at 1530 UTC, 9 September 2001. (return to article)
(9/11/01) Source:


Figure 24. Hurricane Erin on 9/11/01
(9/11/01) Original Image: (more)
Figure 25. Hurricane Erin on 9/11/01
Contrast and brightness adjusted.
(9/11/01) Original Image: (more)

click on images for enlargements.

Hurricane location
September, 2001
11
10
9
8
7
6


Best track positions for Hurricane Erin, September 2001.
Figure 26. 9/11/01
(9/11/01) Source:
Figure 27: Best track for Hurricane Erin, September 2001. Track during the extratropical stage is based on analyses from the NOAA Marine Prediction Center.
Map source:


click on images for enlargements.


Figure 28. 9/4/01
17N, 51.2
(15-20 N,47.5-53W)
(9/04/01) Source:

(1.81, 1.56)
Figure 29. 9/5/01
18.5N, 55.4W
(17-24N, 52-57W)
(9/05/01) Source: 010905_ERIN.jpg

(1.81, 1.53)
Figure 30. 9/6/01
20.8N, 58W
(19-26N, 55-60W)
(9/06/01) Source:

(1.15, 0.99)
Figure 31. 9/7/01
25N, 57.4W
(22-28N, 55-61W)
(9/07/01) Source:

(1.15, 1.01)
Figure 32. 9/8/01
27N, 59W
(25.9-31.5N, 56-61.8W)
(9/08/01) Source:

(1.81, 1.81)


Figure 32. 9/8/01
27N, 59W
(25.9-31.5N, 56-61.8W)
(9/08/01) Source:

(1.81, 1.81)
Figure 33. 9/9/01
31.7N, 62W
(30-35 N, 57-65 W)
(9/09/01) Source:

(1.81, 1.69)
Figure 34. 9/10/01
35.6N, 65.2W
(32-40 N, 62-70W)
(9/10/01) Source:
(1.15, 1.13)
Figure 35. 9/11/01
37.6N, 65.2W
(34-42N, 70-62W)
(9/11/01) Source:

(1.81, 1.81)
Figure 36. 9/12/01
37.8N, 62.1W
(34.5-41, 58-67)
(9/12/01) Source:

(1.15, 1.15)
Hurricane Erin, 9/10/01 to 9/12/02

It is interesting which day Erin was the largest, appearing to fall apart, only to regain strength the following day.


Unprecidented Data Collection Top
NASA Makes A Heated 3-D Look Into Hurricane Erin's Eye

ScienceDaily (Oct. 11, 2005)
Science News, http://www.sciencedaily.com/releases/2005/10/051007090048.htm
[emphasis added]
Figure 37.

Hurricane Erin raced across the North Atlantic and along the eastern seaboard in September 2001. She was

used as an experiment for a study to improve hurricane tracking and intensity predictions, allowing meteorologists to provide more accurate and timely warnings to the public. Studies show that temperatures measured at an extremely high altitude collected from a hurricane's center or eye can provide improved understanding of how hurricanes change intensity.

Hurricane Erin was analyzed during the fourth Convection And Moisture EXperiment (CAMEX-4), which took place from August 16 through September 24, 2001. The mission originated from the Naval Air Station in Jacksonville, Fla. The mission united researchers from 10 universities, five NASA centers and the National Oceanic and Atmospheric Administration. CAMEX-4 is a series of field research investigations to study tropical cyclones & storms commonly known as hurricanes.

Twenty instrumented packages, called dropsondes, were dropped into Erin's eye by two NASA research aircraft (the ER-2 and DC-8). The special packages included instruments that mapped temperature patterns.

For the first time, researchers were able to reconstruct the structure of the eye in three dimensions from as high as 70,000 feet, down to the ocean surface, in great detail. The dropsondes showed Erin's warm core decreasing while it was rapidly weakening, making the storm more vulnerable to wind shear, a change in horizontal winds, which led to the storm falling apart.

Hurricane Erin's rainfall pattern adjusted quickly to surprisingly small changes in wind speed patterns in the surrounding atmosphere. Weak horizontal winds rearrange rain and wind structure, which create uneven weather conditions around the hurricane's core.

Observations from the study show the relationship between warm air from the eye of the storm is linked to reduction in sea surface pressure, which is the basic process that drives the hurricane's destructive winds.

Although little is known about the birth of a hurricane and what causes it to strengthen or weaken, scientists have made substantial steps toward improving predictions of where a hurricane will move or make landfall. The ability to forecast intensity change, however, has always been a challenge for meteorologists.

The research done on Hurricane Erin was important because it could help forecasters understand factors that control rain intensity and distribution for hurricanes landing along the Eastern Seaboard.

Freshwater flooding is the number one killer from hurricanes in the Western Hemisphere and the study of a hurricane's rainfall pattern could better prepare us for the next big storm.

This research paper, titled "Warm Core Structure of Hurricane Erin Diagnosed from High Altitude Dropsondes During CAMEX-4" by J. Halverson et al., is going to be published in an upcoming issue of the American Meteorological Society's Journal of Atmospheric Science, CAMEX Special Issue, at the end of 2005.

Adapted from materials provided by NASA/Goddard Space Flight Center.

Reference 2. Unprecidented data collection: August 16 through September 24, 2001
(According to the table above, Hurricane Erin's duration was September 1 through September 17, 2001)
Source: Science News, www.sciencedaily.com


click on images for enlargements.


Hurricane Erin (10 September 2001)
http://www.aoml.noaa.gov/hrd/HFP2001/erin.html

Figure 38.
The goal of this mission was to obtain coordinated multi-level in situ and remotely sensed observations to support the Surveillance objectives of CAMEX-4 under the USWRP. We hoped to sample the storm at two altitudes in the core with N42RF and the ER-2 to focus our remote sensing and in situ precipitation measurement capabilities on any major precipitation feature. Meanwhile the DC-8 was sampling the near environment of the storm with GPS sondes and the LASE to obtain environmental wind and thermodynamic fields for numerical model initialization

Figure 39.
A very good mission! Good coordination with the ER-2 resulting in an excellent center drop from 65,000 ft ( a first!). Completed the pattern as briefed with a few wrinkles to maintain coordination with the ER-2 and flight safety. In the core there was an interesting variations in the radius of maximum wind at the surface and flight level were found on the north and east side of the storm. The maximum SFMR surface winds were at much smaller ra dii (8-12 km) than the maximum 14,000 ft winds. This difference was evident in the GPS-sondes in the eyewall. We also found two low-level circulation centers evident in the low-level cloud field (see Figure). The surface wind and pressure center appeared to be in the circulation closest to the west eyewall. There was only one apparent wind and pressure center at 14,000 ft, which was closer to the other surface cloud circulation. CN measurements indicated that the eye was relatively dirty with concentrations ~2000 l-1.

Storm/ Date Aircraft (Duration) Altitude Experiment/ Pattern Comments (expendables)
Erin
10 September N42RF (8.9 h) mission summary

PDF
(636 Kb) (archived)
one minute listing
GPS dropsondes
DC-8 (9 h) mission summary
GPS dropsondes
ER-2 (8 h)

WC-130

14 kft


37-39 kft

65 kft


3-plane SurveillanceExperiment.

N42RF, ER-2 within 100 nm radius in core. DC-8

does star pattern between 240-300 nm of center.

  • Erin Hurricane during mission.
    (18 AXBT, 19 GPS sondes)
  • N42RF recovers in Providence, RI to extend on station time. Returns to MacDill AFB on 12 September.
Reference 3.
Source: www.aoml.noaa


Reference Sites Top


Reference Sites
Erin 2001 wind analyses
http://www.aoml.noaa.gov/hrd/Storm_pages/erin2001/wind.html, (archived)

Background on the HRD Surface Wind Analysis System
http://www.aoml.noaa.gov/hrd/Storm_pages/surf_background.html, (archived)

Hurricane Erin 2001
http://www.aoml.noaa.gov/hrd/Storm_pages/erin2001/, (archived)

NASA Makes A Heated 3-D Look Into Hurricane Erin's Eye
http://www.sciencedaily.com/releases/2005/10/051007090048.htm, (archived)

Images and Data from Terra
http://terra.nasa.gov/Gallery/

National Hurricane Center
http://www.nhc.noaa.gov/2001erin.html

Images
http://modis-atmos.gsfc.nasa.gov/IMAGES/index.html


, (archived)
Bermuda


 Continue to next page.


 Continue to next page.


Top homepage
Dirt
WTC & Hutch (JJ)
Erin & Field (erin)
Billiard Balls
Qui Tam Case
Why Indeed
Index Erin1 Erin2
Erin3
Erin4 Erin5 Erin6 Erin7 Erin8 Erin9 Erin10
Appendix_1 Appendix_2 Appendix_3


In accordance with Title 17 U.S.C. Section 107, the articles posted on this webpage are distributed for their included information without profit for research and/or educational purposes only. This webpage has no affiliation whatsoever with the original sources of the articles nor are we sponsored or endorsed by any of the original sources.

© 2006-2008 Judy Wood and the author above. All rights reserved.