|
Hurricane Erin, September 11, 2001
|
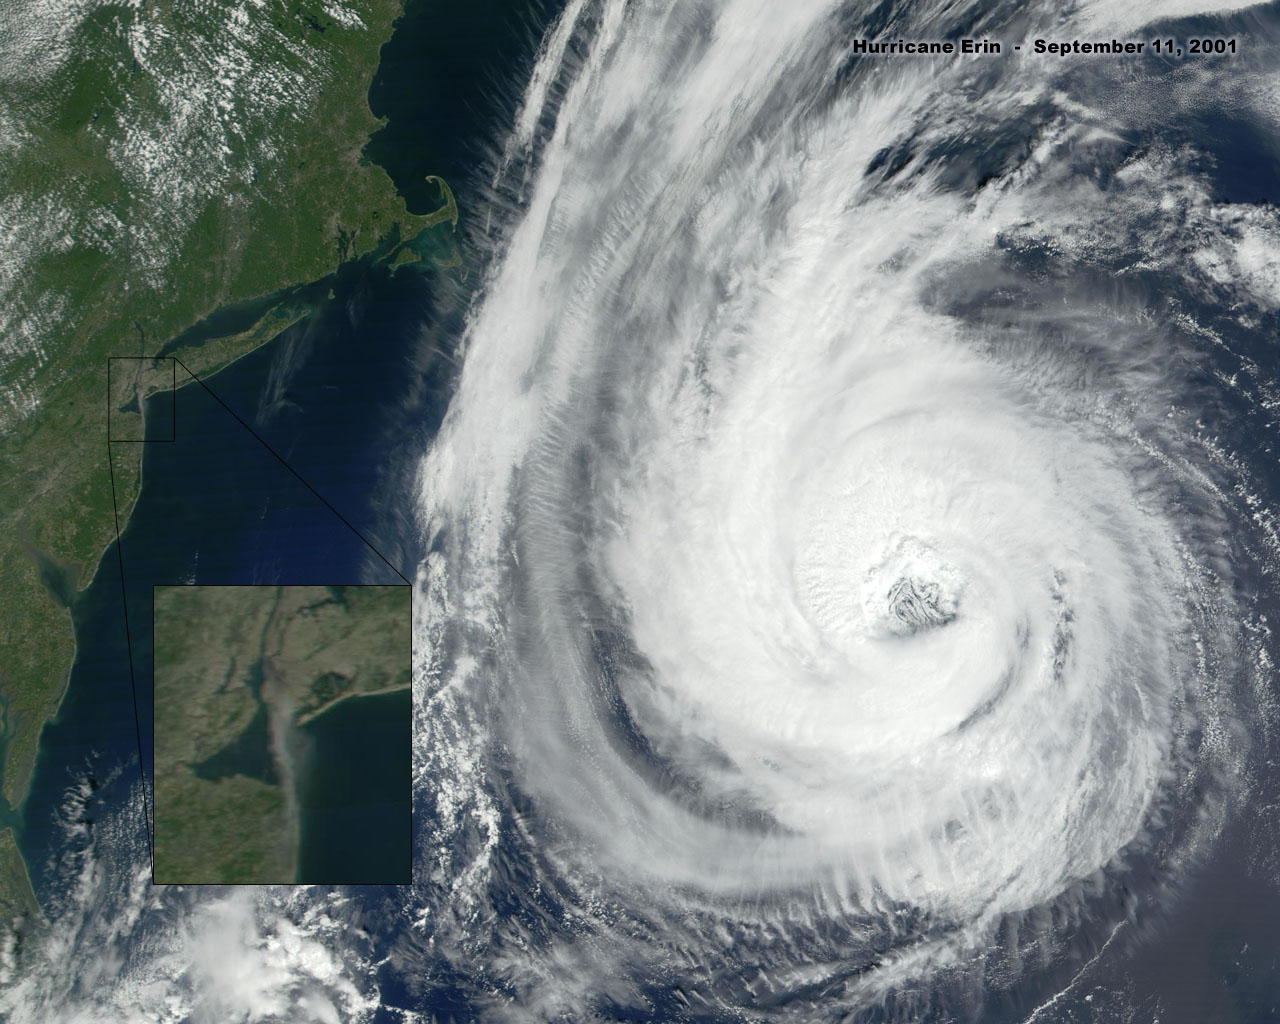 |
| Figure 1. (9/11/01) Source:, (9/11/01) Original Image: (more) 010911_1867.jpeg |
 |
| Source: website:GIMAlong.gif |
| Bottom | homepage |
|
|
|
|
|
|
|
|
by
Judy Wood
This page last updated, July 30, 2008
|
click on images for enlargements.
|
This page is currently UNDER CONSTRUCTION.
|
Hurricane Erin, September 11, 2001
|
|
|
| Figure 1. (9/11/01) Source:, (9/11/01) Original Image: (more) 010911_1867.jpeg |
|
|
| Source: website:GIMAlong.gif |
|
Information about what is shown in Figures 4-9, below.
|
|
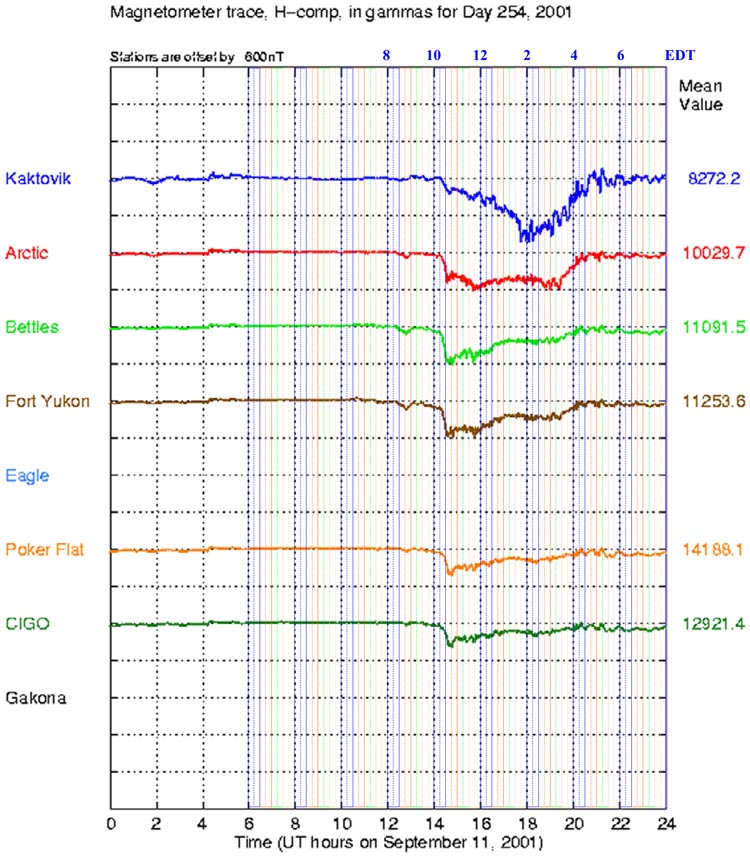
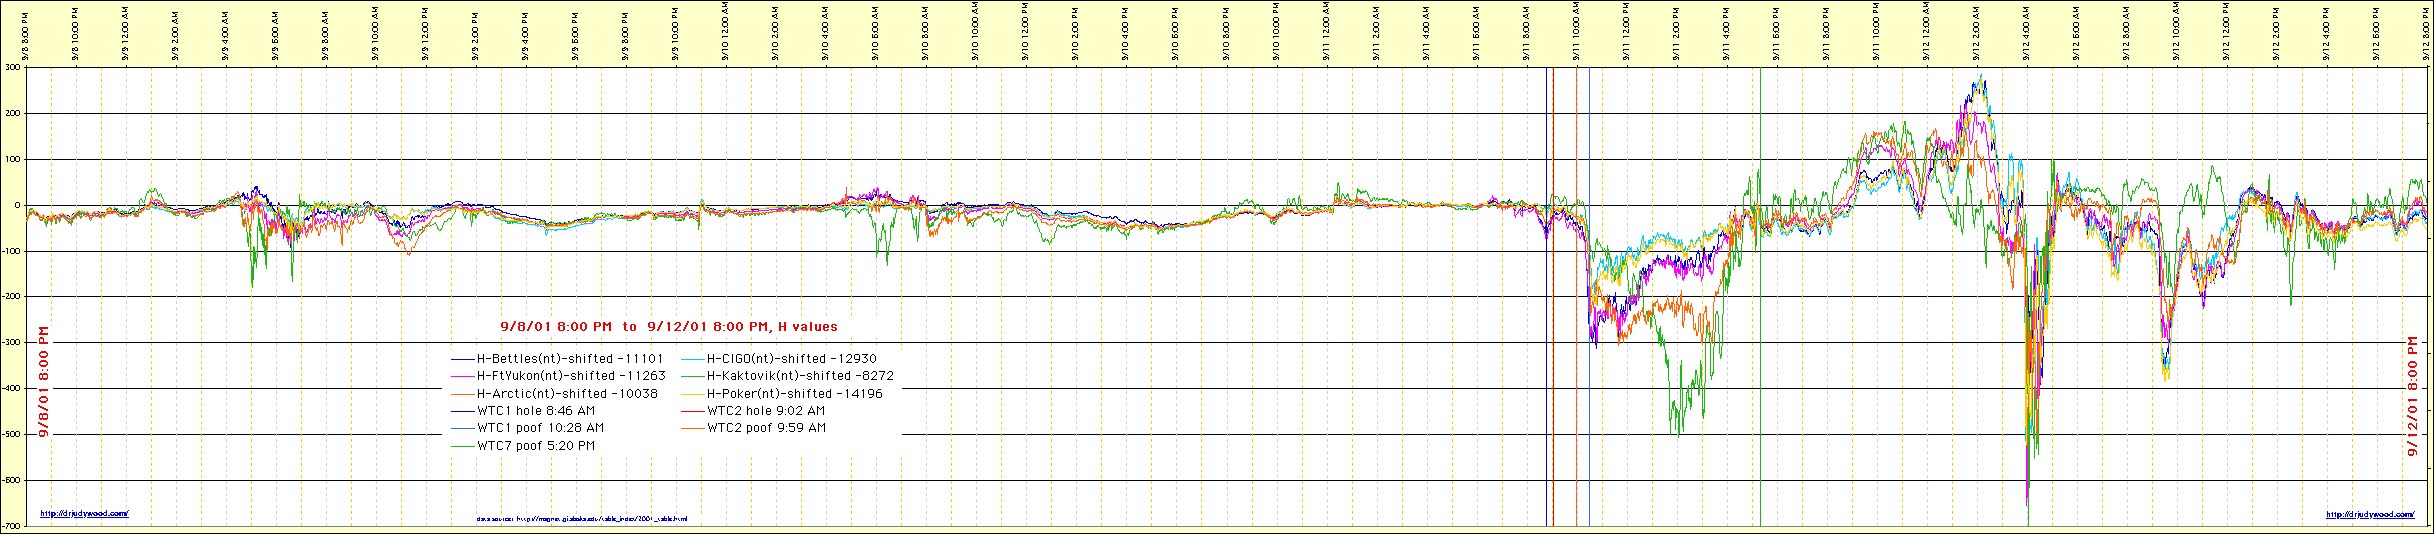
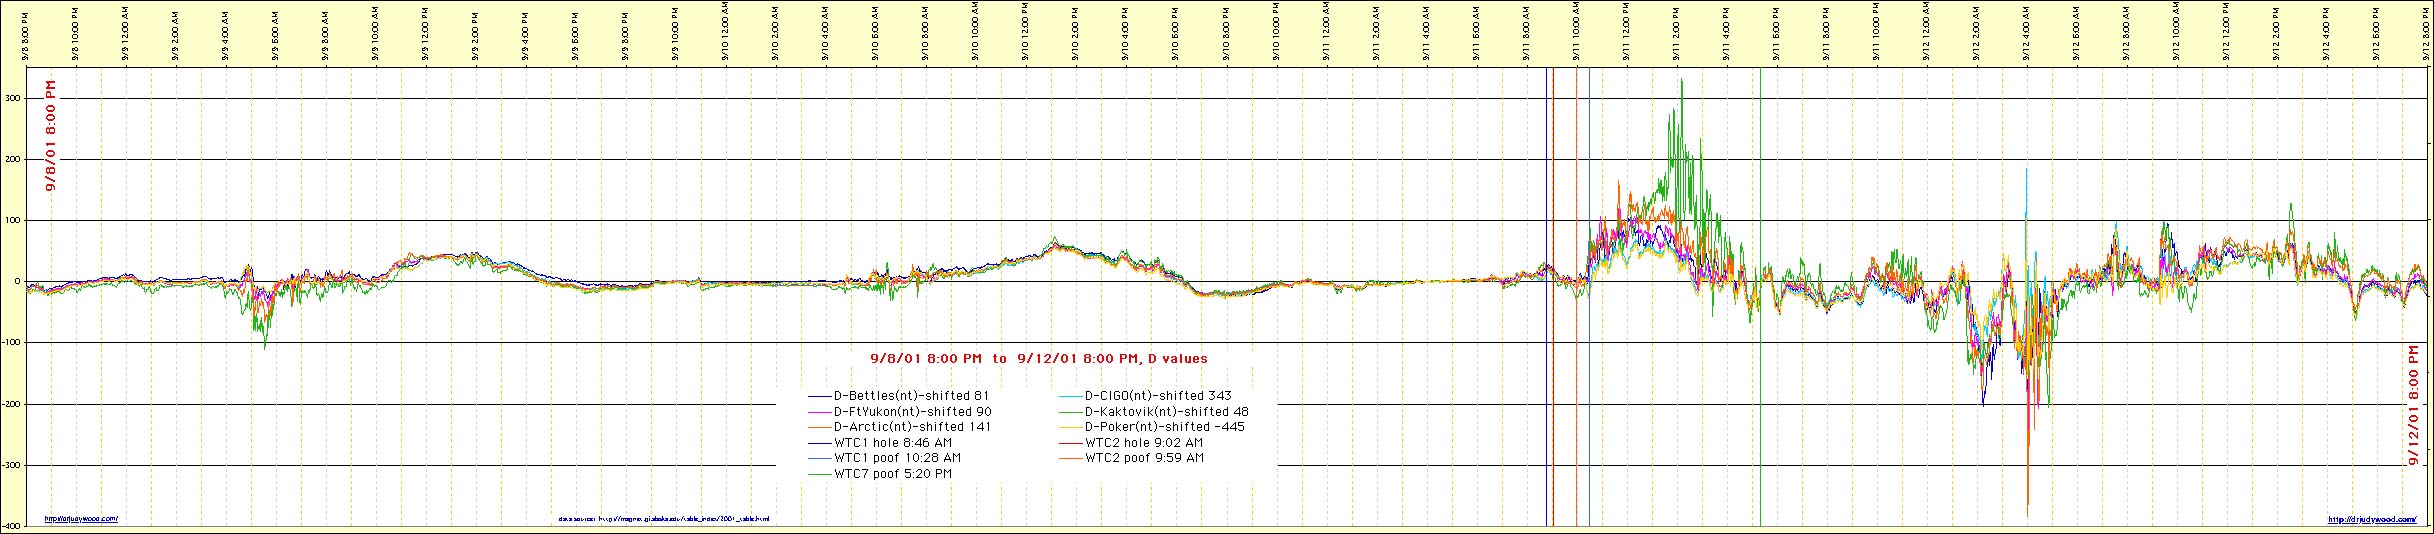
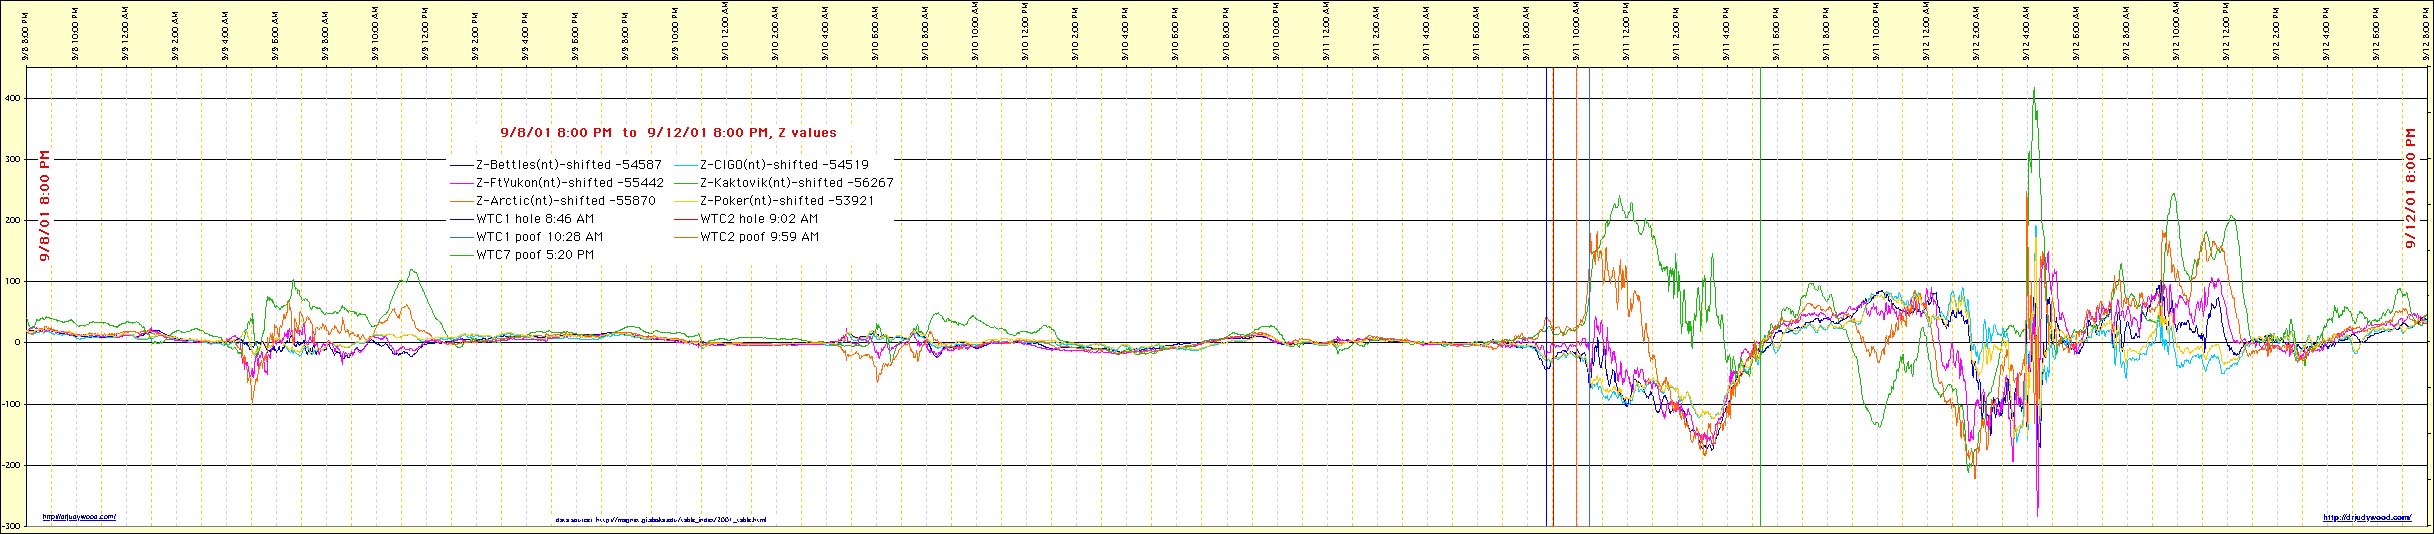
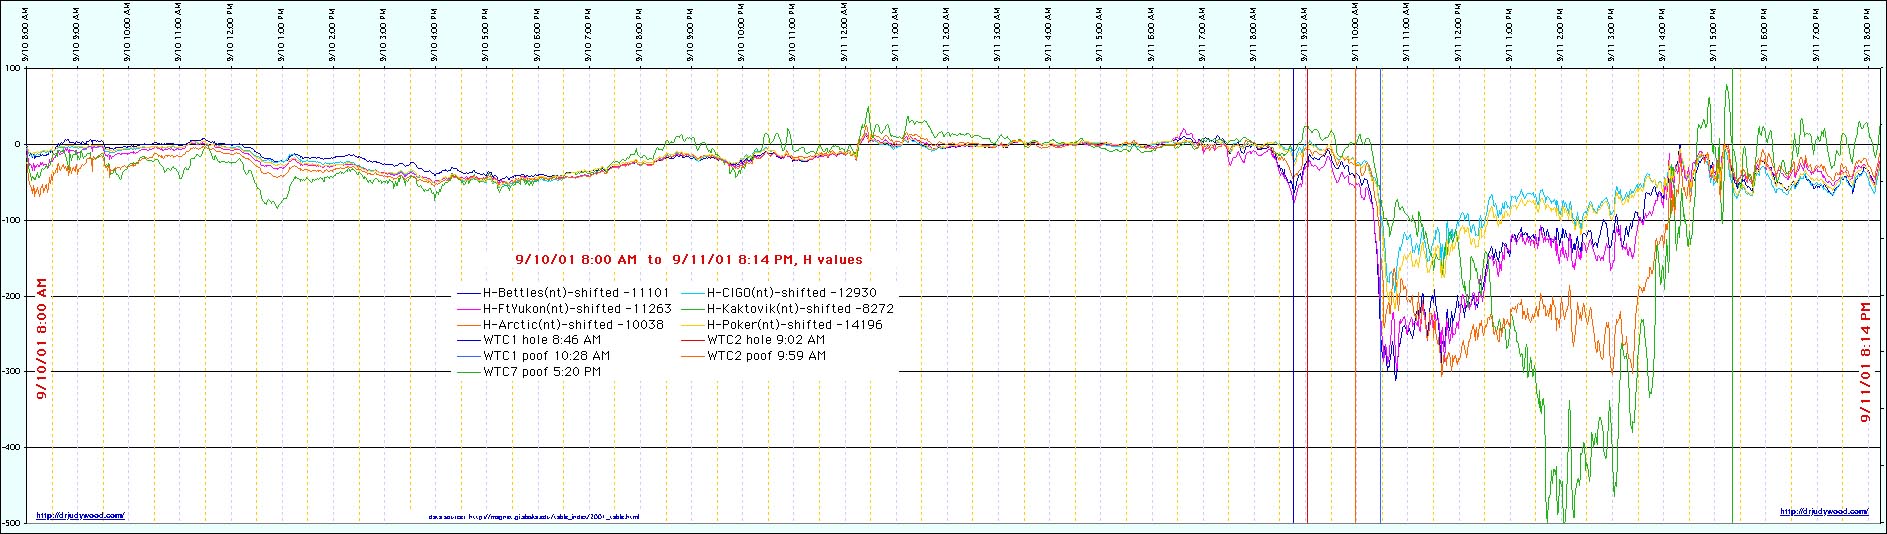
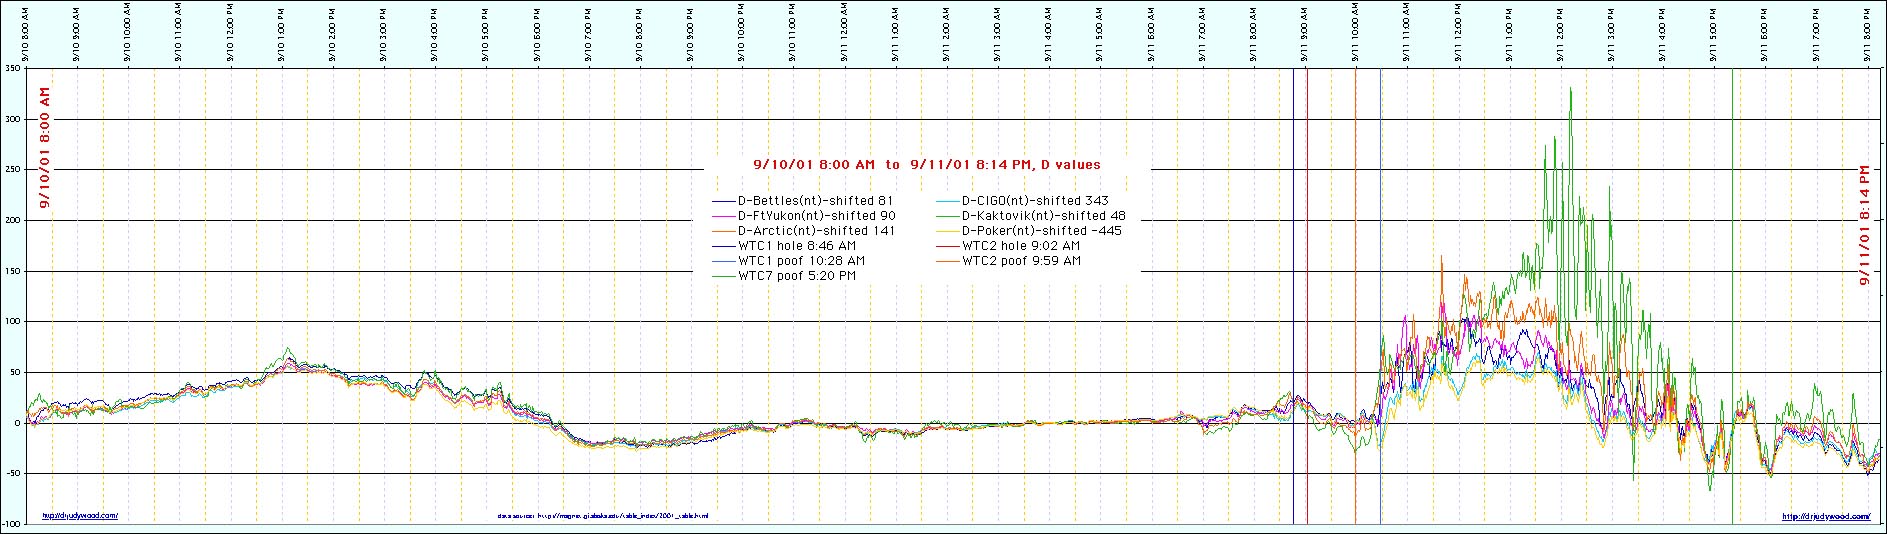
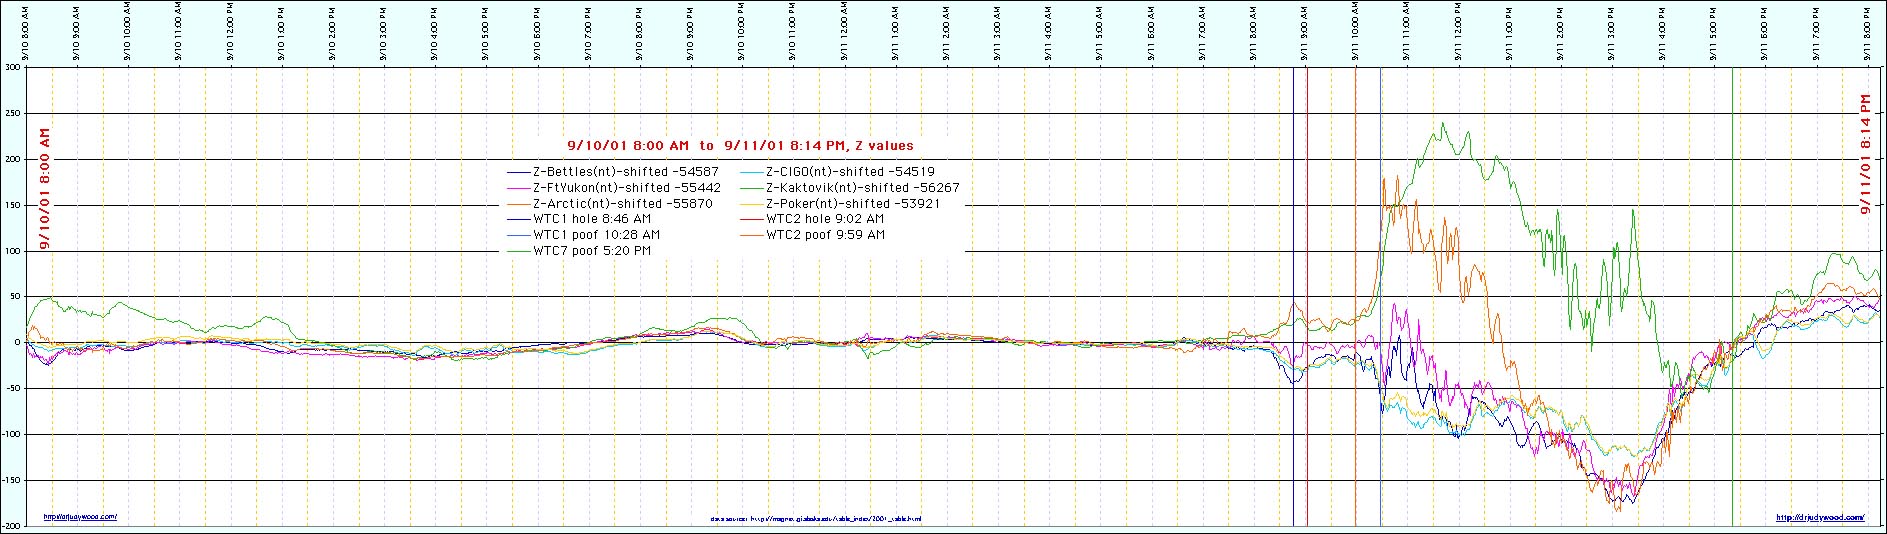
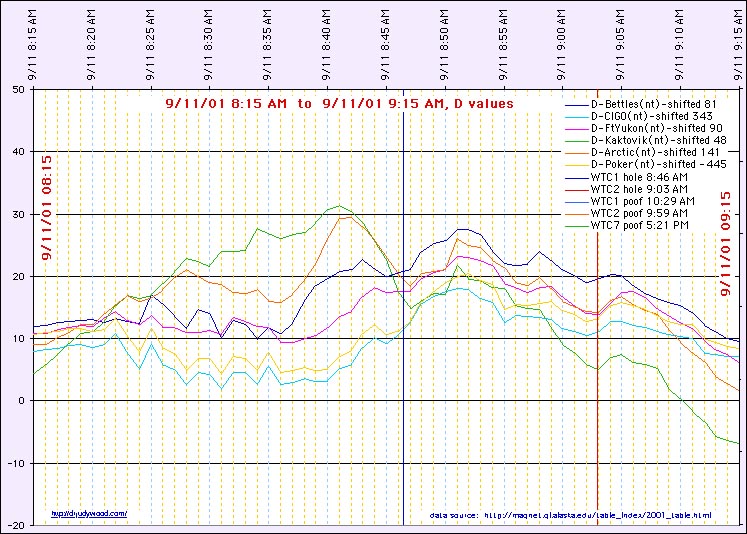
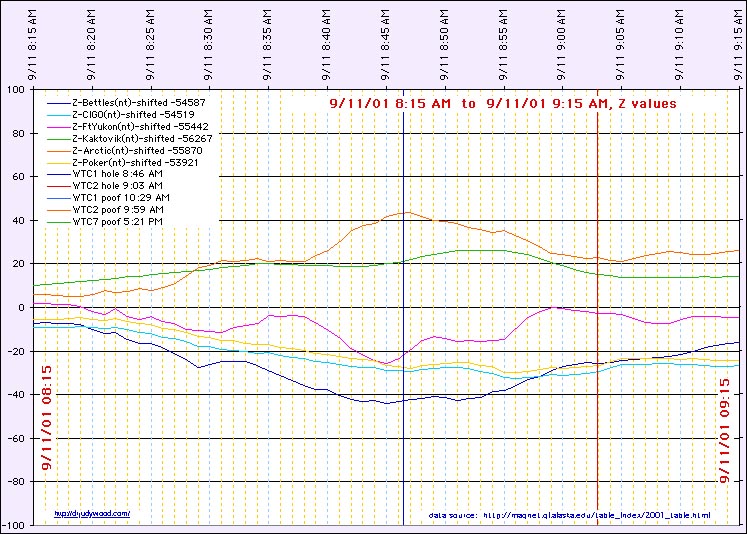
"This is a timeseries of the magnetometer deviations for the indicated UTC day and station. The horizontal and vertical grids are constant for each plot so the user can quickly flip through images looking for quiet and active periods.
he horizontal scale is always a full 24 hours. The vertical grid is 250 nano-Tesla/grid line. The mean value (in nano-Tesla) printed off the right hand edge of the plot is the average magnetic field strength for that day for each component. The magnetic deviation displayed is computed from that value. The H-component (deviations down indicate the local field has dipped southward) has the greatest deviations in that direction and so is plotted on top. The D-component dips are magnetic west deviations as the magnetometer head is oriented in magnetic coordinates not geographic. The Z component is vertical component. Note: Each component is offset by 2 vertical grid boxes (500 nT) where the component letter indicator off the left and the mean value on the right indicate the zero reference point for each curve. This was done so each component could be identified separately and does not reflect the absolute magnitude of the magnetic field of the component." |
| Quote 1. Information about what is shown in Figures 4-9, below. website: |
|
click on images for enlargements.
|
Magnetic Anomalies on 9/11/2001 Top
 |
|
|||||||||||||||||||||||||||||||||||||||||||||||
| Figure 2. Source: website:akmap.gif |
||||||||||||||||||||||||||||||||||||||||||||||||
|
||||||||||||||||||||||||||||||||||||||||||||||||
 |
||||||||||||||||||||||||||||||||||||||||||||||||
| Figure 3. Grid lines added. (Larger version) (unmarked version1, version2) Original: Source: website: |
|
click on images for enlargements.
|
| Figure 10. H1 Source: website: |
 |
| Figure 11. D1 Source: website: |
 |
| Figure 12. Z1 Source: website: |
 |
|
click on images for enlargements.
|
| Figure 13. H2 Source: website: |
 |
| Figure 14. D2 Source: website: |
 |
| Figure 15. Z2 Source: website: |
 |
|
click on images for enlargements.
|
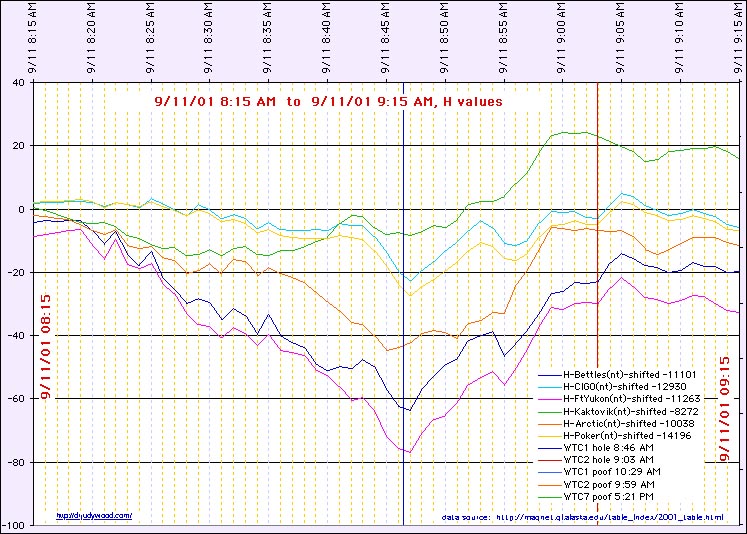
Magnetometer Readings (normalized), 6 stations (1 hour), 9/11/01-8:15 AM (EDT) - 9/11/01-9:15 AM (EDT) Top
Magnetometer Readings (normalized), 6 stations (3 hours), 9/11/01-8:00 AM (EDT) - 9/11/01-11:00 AM (EDT) Top
(data posted at one-minute intervals)
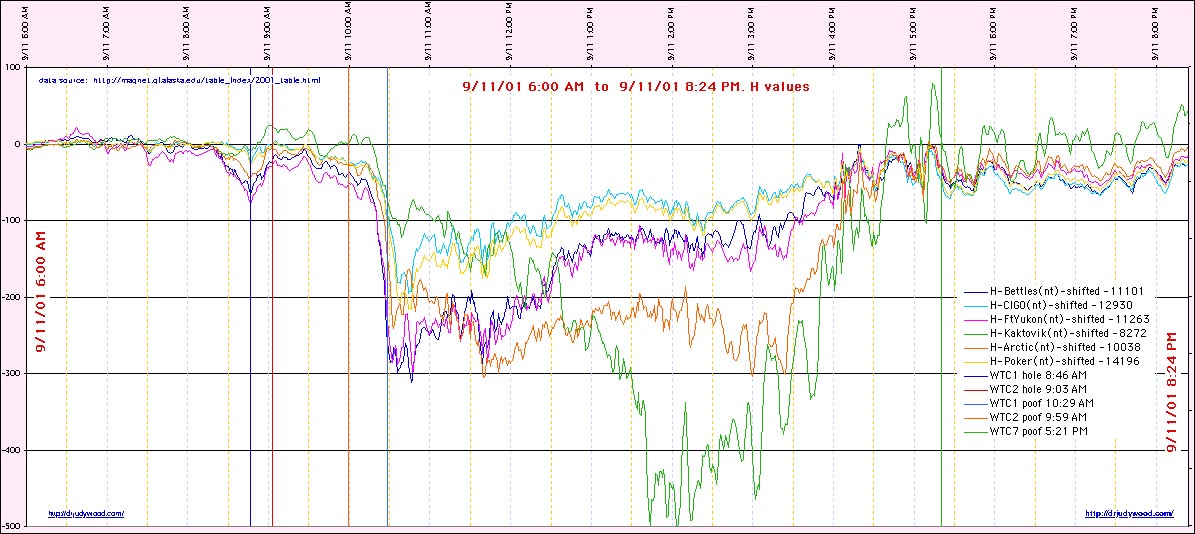
| Figure 16a. H5 Source: website: |
 |
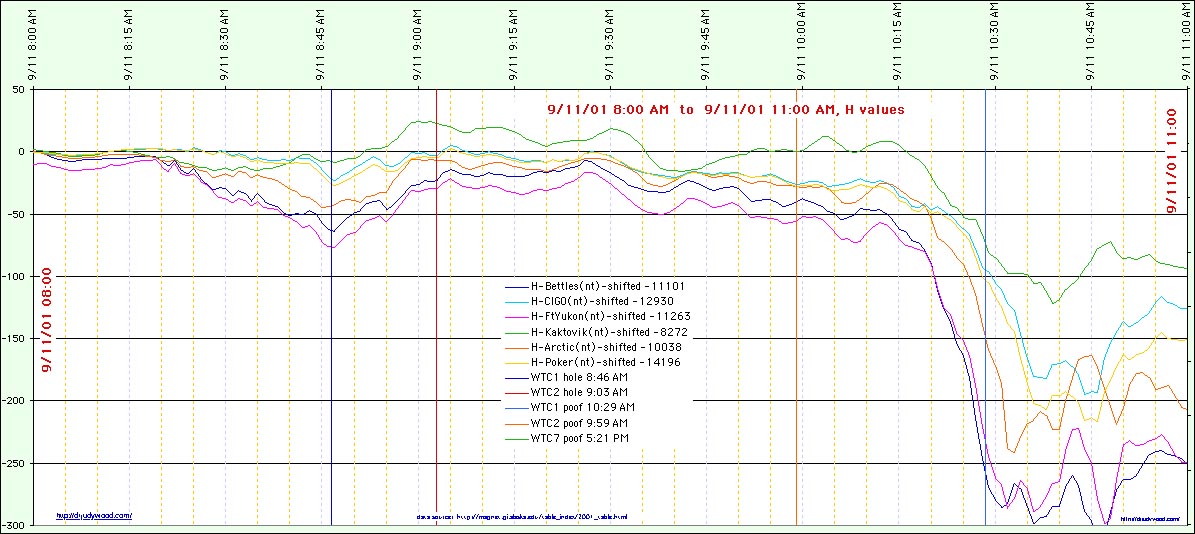 |
Figure 16b. H4 Source: website: |
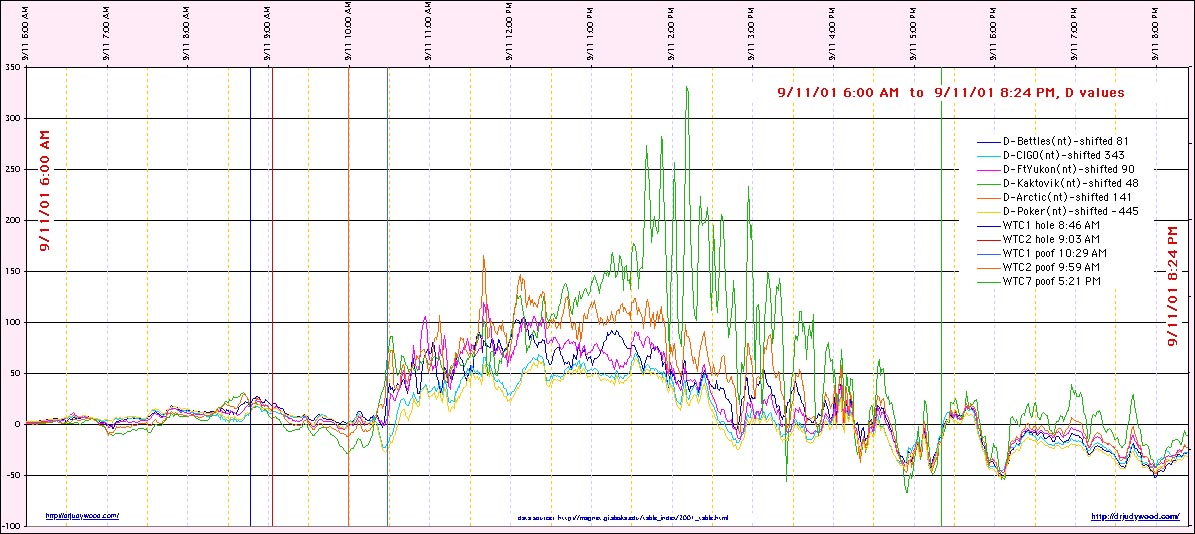
| Figure 17a. D5 Source: website: |
 |
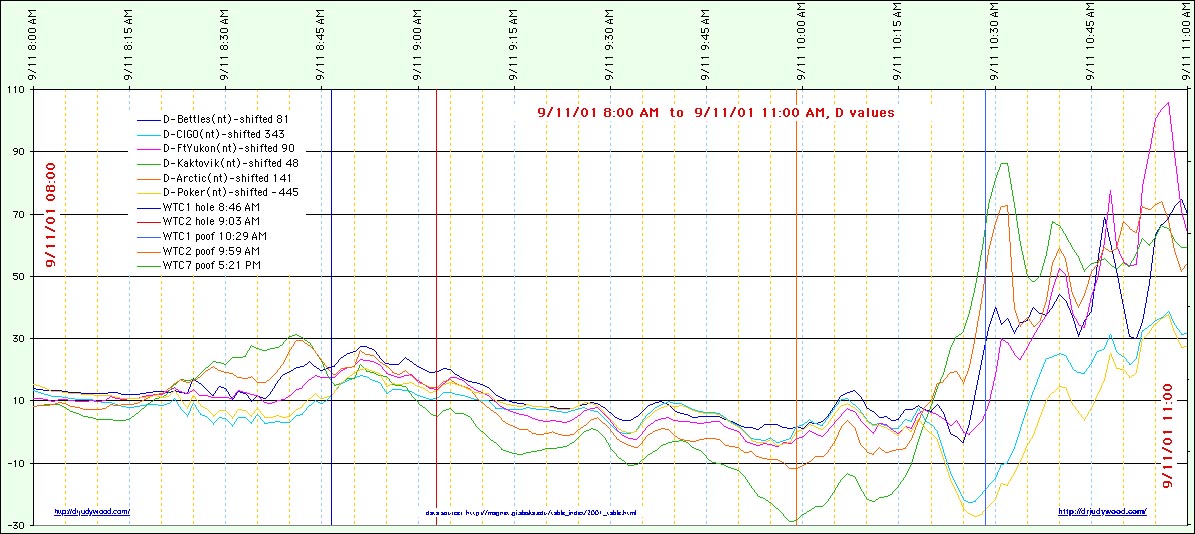 |
Figure 17b. D4 Source: website: |
| Figure 18a. Z5 Source: website: |
 |
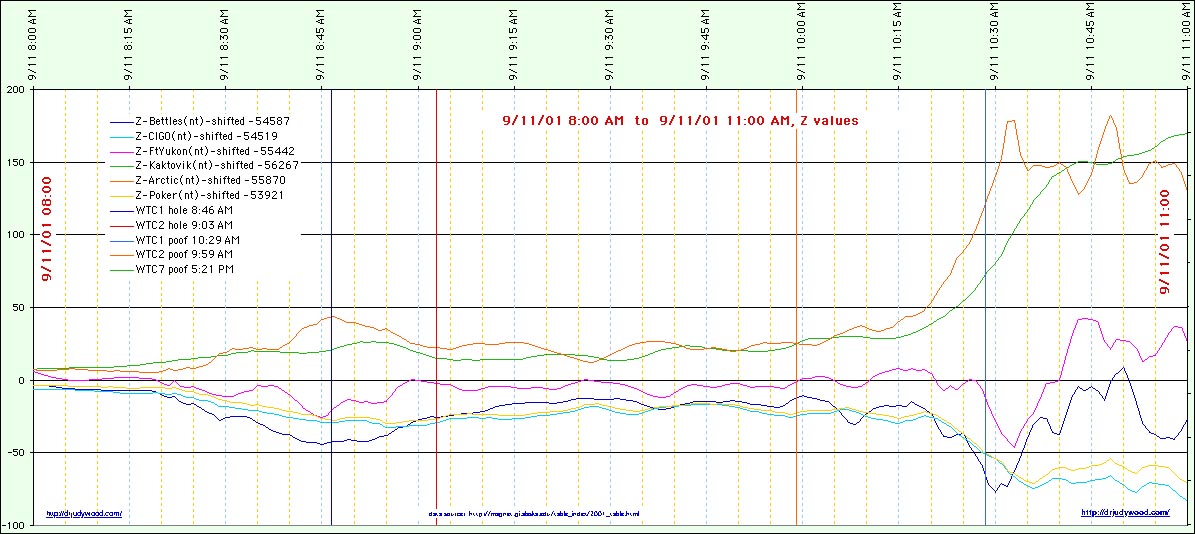 |
Figure 18b. Z4 Source: website: |
|
click on images for enlargements.
|
| Figure 19a. H3 Source: website: |
 |
 |
Figure 19b. H6 Source: website: |
| Figure 20a. D3 Source: website: |
 |
 |
Figure 20b. D6 Source: website: |
| Figure 21a. Z3 Source: website: |
 |
 |
Figure 21b. Z6 Source: website: |
|
click on images for enlargements.
|
|
click on images for enlargements.
|
| 2001 |
2004 |
2005 |
||||||||||||||||||||||||||||||||||||||||||||||||||||||||||||||||||||||||||||||||||||||||||||||||||||||||||||||||||||||||||||||||||||||||||||||||||||||||||||||||||||||||||||||||||||||||||||||||||||||||||||||||||||||||||||||||||||||||||||||||||||||||||||||||||||||||||||||||||||||||||||||||||||||||||||||||||||||||||||||||||||||||||||||||||||||||||||||
 |
 |
 |
||||||||||||||||||||||||||||||||||||||||||||||||||||||||||||||||||||||||||||||||||||||||||||||||||||||||||||||||||||||||||||||||||||||||||||||||||||||||||||||||||||||||||||||||||||||||||||||||||||||||||||||||||||||||||||||||||||||||||||||||||||||||||||||||||||||||||||||||||||||||||||||||||||||||||||||||||||||||||||||||||||||||||||||||||||||||||||||
| Figure 10. 2001 Hurricanes source: |
Figure 30. 2004 Hurricanes source: |
Figure 50. 2005 Hurricanes source: |
||||||||||||||||||||||||||||||||||||||||||||||||||||||||||||||||||||||||||||||||||||||||||||||||||||||||||||||||||||||||||||||||||||||||||||||||||||||||||||||||||||||||||||||||||||||||||||||||||||||||||||||||||||||||||||||||||||||||||||||||||||||||||||||||||||||||||||||||||||||||||||||||||||||||||||||||||||||||||||||||||||||||||||||||||||||||||||||
 |
 |
 |
||||||||||||||||||||||||||||||||||||||||||||||||||||||||||||||||||||||||||||||||||||||||||||||||||||||||||||||||||||||||||||||||||||||||||||||||||||||||||||||||||||||||||||||||||||||||||||||||||||||||||||||||||||||||||||||||||||||||||||||||||||||||||||||||||||||||||||||||||||||||||||||||||||||||||||||||||||||||||||||||||||||||||||||||||||||||||||||
| Figure 11. 2001 Hurricanes Source: website: |
Figure 31. 2004 Hurricanes Source: website: |
Figure 51. 2005 Hurricanes Source: website: |
||||||||||||||||||||||||||||||||||||||||||||||||||||||||||||||||||||||||||||||||||||||||||||||||||||||||||||||||||||||||||||||||||||||||||||||||||||||||||||||||||||||||||||||||||||||||||||||||||||||||||||||||||||||||||||||||||||||||||||||||||||||||||||||||||||||||||||||||||||||||||||||||||||||||||||||||||||||||||||||||||||||||||||||||||||||||||||||
Table A. TROPICAL CYCLONE REPORTS
|
Table B.
Source: Source1: |
Table C.
Source: Source1: |
||||||||||||||||||||||||||||||||||||||||||||||||||||||||||||||||||||||||||||||||||||||||||||||||||||||||||||||||||||||||||||||||||||||||||||||||||||||||||||||||||||||||||||||||||||||||||||||||||||||||||||||||||||||||||||||||||||||||||||||||||||||||||||||||||||||||||||||||||||||||||||||||||||||||||||||||||||||||||||||||||||||||||||||||||||||||||||||
 |
 |
 |
||||||||||||||||||||||||||||||||||||||||||||||||||||||||||||||||||||||||||||||||||||||||||||||||||||||||||||||||||||||||||||||||||||||||||||||||||||||||||||||||||||||||||||||||||||||||||||||||||||||||||||||||||||||||||||||||||||||||||||||||||||||||||||||||||||||||||||||||||||||||||||||||||||||||||||||||||||||||||||||||||||||||||||||||||||||||||||||
| Figure 12. January 2001 Source: website: 20010128_1mo.jpg |
Figure 32. January 2004 Source: website: 20040128_1mo.jpg |
Figure 52.January 2005 Source: website: 20050128_1mo.jpg |
||||||||||||||||||||||||||||||||||||||||||||||||||||||||||||||||||||||||||||||||||||||||||||||||||||||||||||||||||||||||||||||||||||||||||||||||||||||||||||||||||||||||||||||||||||||||||||||||||||||||||||||||||||||||||||||||||||||||||||||||||||||||||||||||||||||||||||||||||||||||||||||||||||||||||||||||||||||||||||||||||||||||||||||||||||||||||||||
 |
 |
 |
||||||||||||||||||||||||||||||||||||||||||||||||||||||||||||||||||||||||||||||||||||||||||||||||||||||||||||||||||||||||||||||||||||||||||||||||||||||||||||||||||||||||||||||||||||||||||||||||||||||||||||||||||||||||||||||||||||||||||||||||||||||||||||||||||||||||||||||||||||||||||||||||||||||||||||||||||||||||||||||||||||||||||||||||||||||||||||||
| Figure 13. January 2001 Source: website: 20010201_1mo.jpg, |
Figure 33. January 2004 Source: website: 20040201_1mo.jpg, |
Figure 53. January 2005 Source: website: 20050201_1mo.jpg |
||||||||||||||||||||||||||||||||||||||||||||||||||||||||||||||||||||||||||||||||||||||||||||||||||||||||||||||||||||||||||||||||||||||||||||||||||||||||||||||||||||||||||||||||||||||||||||||||||||||||||||||||||||||||||||||||||||||||||||||||||||||||||||||||||||||||||||||||||||||||||||||||||||||||||||||||||||||||||||||||||||||||||||||||||||||||||||||
 |
 |
 |
||||||||||||||||||||||||||||||||||||||||||||||||||||||||||||||||||||||||||||||||||||||||||||||||||||||||||||||||||||||||||||||||||||||||||||||||||||||||||||||||||||||||||||||||||||||||||||||||||||||||||||||||||||||||||||||||||||||||||||||||||||||||||||||||||||||||||||||||||||||||||||||||||||||||||||||||||||||||||||||||||||||||||||||||||||||||||||||
| Figure 14. February 2001 Source: website: 20010303_1mo.jpg, |
Figure 34. February 2004 Source: website: 20040303_1mo.jpg, |
Figure 54. February 2005 Source: website: 20050303_1mo.jpg |
||||||||||||||||||||||||||||||||||||||||||||||||||||||||||||||||||||||||||||||||||||||||||||||||||||||||||||||||||||||||||||||||||||||||||||||||||||||||||||||||||||||||||||||||||||||||||||||||||||||||||||||||||||||||||||||||||||||||||||||||||||||||||||||||||||||||||||||||||||||||||||||||||||||||||||||||||||||||||||||||||||||||||||||||||||||||||||||
 |
 |
 |
||||||||||||||||||||||||||||||||||||||||||||||||||||||||||||||||||||||||||||||||||||||||||||||||||||||||||||||||||||||||||||||||||||||||||||||||||||||||||||||||||||||||||||||||||||||||||||||||||||||||||||||||||||||||||||||||||||||||||||||||||||||||||||||||||||||||||||||||||||||||||||||||||||||||||||||||||||||||||||||||||||||||||||||||||||||||||||||
| Figure 15. March 2001 Source: website: 20010402_1mo.jpg, |
Figure 35. March 2004 Source: website: 20040402_1mo.jpg |
Figure 55. March 2005 Source: website: 20050402_1mo.jpg, |
||||||||||||||||||||||||||||||||||||||||||||||||||||||||||||||||||||||||||||||||||||||||||||||||||||||||||||||||||||||||||||||||||||||||||||||||||||||||||||||||||||||||||||||||||||||||||||||||||||||||||||||||||||||||||||||||||||||||||||||||||||||||||||||||||||||||||||||||||||||||||||||||||||||||||||||||||||||||||||||||||||||||||||||||||||||||||||||
 |
 |
 |
||||||||||||||||||||||||||||||||||||||||||||||||||||||||||||||||||||||||||||||||||||||||||||||||||||||||||||||||||||||||||||||||||||||||||||||||||||||||||||||||||||||||||||||||||||||||||||||||||||||||||||||||||||||||||||||||||||||||||||||||||||||||||||||||||||||||||||||||||||||||||||||||||||||||||||||||||||||||||||||||||||||||||||||||||||||||||||||
| Figure 16. April 2001 Source: website: 20010502_1mo.jpg, |
Figure 36. April 2004 Source: website: 20040502_1mo.jpg |
Figure 56. April 2005 Source: website: 20050502_1mo.jpg, |
||||||||||||||||||||||||||||||||||||||||||||||||||||||||||||||||||||||||||||||||||||||||||||||||||||||||||||||||||||||||||||||||||||||||||||||||||||||||||||||||||||||||||||||||||||||||||||||||||||||||||||||||||||||||||||||||||||||||||||||||||||||||||||||||||||||||||||||||||||||||||||||||||||||||||||||||||||||||||||||||||||||||||||||||||||||||||||||
 |
 |
 |
||||||||||||||||||||||||||||||||||||||||||||||||||||||||||||||||||||||||||||||||||||||||||||||||||||||||||||||||||||||||||||||||||||||||||||||||||||||||||||||||||||||||||||||||||||||||||||||||||||||||||||||||||||||||||||||||||||||||||||||||||||||||||||||||||||||||||||||||||||||||||||||||||||||||||||||||||||||||||||||||||||||||||||||||||||||||||||||
| Figure 17. May 2001 Source: website: 20010601_1mo.jpg, |
Figure 37. May 2004 Source: website: 20040601_1mo.jpg |
Figure 57. May 2005 Source: website: 20050601_1mo.jpg, |
||||||||||||||||||||||||||||||||||||||||||||||||||||||||||||||||||||||||||||||||||||||||||||||||||||||||||||||||||||||||||||||||||||||||||||||||||||||||||||||||||||||||||||||||||||||||||||||||||||||||||||||||||||||||||||||||||||||||||||||||||||||||||||||||||||||||||||||||||||||||||||||||||||||||||||||||||||||||||||||||||||||||||||||||||||||||||||||
 |
 |
 |
||||||||||||||||||||||||||||||||||||||||||||||||||||||||||||||||||||||||||||||||||||||||||||||||||||||||||||||||||||||||||||||||||||||||||||||||||||||||||||||||||||||||||||||||||||||||||||||||||||||||||||||||||||||||||||||||||||||||||||||||||||||||||||||||||||||||||||||||||||||||||||||||||||||||||||||||||||||||||||||||||||||||||||||||||||||||||||||
| Figure 18. June 2001 Source: website: 20010701_1mo.jpg, |
Figure 38. June 2004 Source: website: 20040701_1mo.jpg |
Figure 58. June 2005 Source: website: 20050701_1mo.jpg, |
||||||||||||||||||||||||||||||||||||||||||||||||||||||||||||||||||||||||||||||||||||||||||||||||||||||||||||||||||||||||||||||||||||||||||||||||||||||||||||||||||||||||||||||||||||||||||||||||||||||||||||||||||||||||||||||||||||||||||||||||||||||||||||||||||||||||||||||||||||||||||||||||||||||||||||||||||||||||||||||||||||||||||||||||||||||||||||||
 |
 |
 |
||||||||||||||||||||||||||||||||||||||||||||||||||||||||||||||||||||||||||||||||||||||||||||||||||||||||||||||||||||||||||||||||||||||||||||||||||||||||||||||||||||||||||||||||||||||||||||||||||||||||||||||||||||||||||||||||||||||||||||||||||||||||||||||||||||||||||||||||||||||||||||||||||||||||||||||||||||||||||||||||||||||||||||||||||||||||||||||
| Figure 19. July 2001 Source: website: 20010731_1mo.jpg, |
Figure 39. July 2004 Source: website: 20040731_1mo.jpg |
Figure 59. July 2005 Source: website: 20050731_1mo.jpg, |
||||||||||||||||||||||||||||||||||||||||||||||||||||||||||||||||||||||||||||||||||||||||||||||||||||||||||||||||||||||||||||||||||||||||||||||||||||||||||||||||||||||||||||||||||||||||||||||||||||||||||||||||||||||||||||||||||||||||||||||||||||||||||||||||||||||||||||||||||||||||||||||||||||||||||||||||||||||||||||||||||||||||||||||||||||||||||||||
 |
 |
 |
||||||||||||||||||||||||||||||||||||||||||||||||||||||||||||||||||||||||||||||||||||||||||||||||||||||||||||||||||||||||||||||||||||||||||||||||||||||||||||||||||||||||||||||||||||||||||||||||||||||||||||||||||||||||||||||||||||||||||||||||||||||||||||||||||||||||||||||||||||||||||||||||||||||||||||||||||||||||||||||||||||||||||||||||||||||||||||||
| Figure 20. August 2001 Source: Source1: website: 20010830_1mo.jpg, |
Figure 40. August 2004 Source: website: 20040830_1mo.jpg, |
Figure 60. August 2005 Source: website: 20050830_1mo.jpg, |
||||||||||||||||||||||||||||||||||||||||||||||||||||||||||||||||||||||||||||||||||||||||||||||||||||||||||||||||||||||||||||||||||||||||||||||||||||||||||||||||||||||||||||||||||||||||||||||||||||||||||||||||||||||||||||||||||||||||||||||||||||||||||||||||||||||||||||||||||||||||||||||||||||||||||||||||||||||||||||||||||||||||||||||||||||||||||||||
 |
 |
 |
||||||||||||||||||||||||||||||||||||||||||||||||||||||||||||||||||||||||||||||||||||||||||||||||||||||||||||||||||||||||||||||||||||||||||||||||||||||||||||||||||||||||||||||||||||||||||||||||||||||||||||||||||||||||||||||||||||||||||||||||||||||||||||||||||||||||||||||||||||||||||||||||||||||||||||||||||||||||||||||||||||||||||||||||||||||||||||||
| Figure 21. August 2001 Source: Source1: website: 20010831_1mo.jpg, |
Figure 41. August 2004 Source: website: 20040831_1mo.jpg |
Figure 61. August 2005 Source: website: 20050831_1mo.jpg, |
||||||||||||||||||||||||||||||||||||||||||||||||||||||||||||||||||||||||||||||||||||||||||||||||||||||||||||||||||||||||||||||||||||||||||||||||||||||||||||||||||||||||||||||||||||||||||||||||||||||||||||||||||||||||||||||||||||||||||||||||||||||||||||||||||||||||||||||||||||||||||||||||||||||||||||||||||||||||||||||||||||||||||||||||||||||||||||||
 |
 |
 |
||||||||||||||||||||||||||||||||||||||||||||||||||||||||||||||||||||||||||||||||||||||||||||||||||||||||||||||||||||||||||||||||||||||||||||||||||||||||||||||||||||||||||||||||||||||||||||||||||||||||||||||||||||||||||||||||||||||||||||||||||||||||||||||||||||||||||||||||||||||||||||||||||||||||||||||||||||||||||||||||||||||||||||||||||||||||||||||
| Figure 22. September 2001 Source: Soure1: website: 20010930_1mo.jpg, |
Figure 42. September 2004 Source: website: 20040930_1mo.jpg |
Figure 62. September 2005 Source: website: 20050930_1mo.jpg, |
||||||||||||||||||||||||||||||||||||||||||||||||||||||||||||||||||||||||||||||||||||||||||||||||||||||||||||||||||||||||||||||||||||||||||||||||||||||||||||||||||||||||||||||||||||||||||||||||||||||||||||||||||||||||||||||||||||||||||||||||||||||||||||||||||||||||||||||||||||||||||||||||||||||||||||||||||||||||||||||||||||||||||||||||||||||||||||||
 |
 |
 |
||||||||||||||||||||||||||||||||||||||||||||||||||||||||||||||||||||||||||||||||||||||||||||||||||||||||||||||||||||||||||||||||||||||||||||||||||||||||||||||||||||||||||||||||||||||||||||||||||||||||||||||||||||||||||||||||||||||||||||||||||||||||||||||||||||||||||||||||||||||||||||||||||||||||||||||||||||||||||||||||||||||||||||||||||||||||||||||
| Figure 23. October 2001 Source: website: 20011030_1mo.jpg, |
Figure 43. October 2004 Source: website: 20041030_1mo.jpg |
Figure 63. October 2005 Source: website: 20051030_1mo.jpg, |
||||||||||||||||||||||||||||||||||||||||||||||||||||||||||||||||||||||||||||||||||||||||||||||||||||||||||||||||||||||||||||||||||||||||||||||||||||||||||||||||||||||||||||||||||||||||||||||||||||||||||||||||||||||||||||||||||||||||||||||||||||||||||||||||||||||||||||||||||||||||||||||||||||||||||||||||||||||||||||||||||||||||||||||||||||||||||||||
 |
 |
 |
||||||||||||||||||||||||||||||||||||||||||||||||||||||||||||||||||||||||||||||||||||||||||||||||||||||||||||||||||||||||||||||||||||||||||||||||||||||||||||||||||||||||||||||||||||||||||||||||||||||||||||||||||||||||||||||||||||||||||||||||||||||||||||||||||||||||||||||||||||||||||||||||||||||||||||||||||||||||||||||||||||||||||||||||||||||||||||||
| Figure 24. November 2001 Source: website: 20011129_1mo.jpg, |
Figure 44. November 2004 Source: website: 20041129_1mo.jpg |
Figure 64. November 2005 Source: website: 20051129_1mo.jpg, |
||||||||||||||||||||||||||||||||||||||||||||||||||||||||||||||||||||||||||||||||||||||||||||||||||||||||||||||||||||||||||||||||||||||||||||||||||||||||||||||||||||||||||||||||||||||||||||||||||||||||||||||||||||||||||||||||||||||||||||||||||||||||||||||||||||||||||||||||||||||||||||||||||||||||||||||||||||||||||||||||||||||||||||||||||||||||||||||
 |
 |
 |
||||||||||||||||||||||||||||||||||||||||||||||||||||||||||||||||||||||||||||||||||||||||||||||||||||||||||||||||||||||||||||||||||||||||||||||||||||||||||||||||||||||||||||||||||||||||||||||||||||||||||||||||||||||||||||||||||||||||||||||||||||||||||||||||||||||||||||||||||||||||||||||||||||||||||||||||||||||||||||||||||||||||||||||||||||||||||||||
| Figure 25. December 2001 Source: website: 20011229_1mo.jpg, |
Figure 45. December 2004 Source: website: 20041229_1mo.jpg |
Figure 65. December 2005 Source: website: 20051229_1mo.jpg, |
||||||||||||||||||||||||||||||||||||||||||||||||||||||||||||||||||||||||||||||||||||||||||||||||||||||||||||||||||||||||||||||||||||||||||||||||||||||||||||||||||||||||||||||||||||||||||||||||||||||||||||||||||||||||||||||||||||||||||||||||||||||||||||||||||||||||||||||||||||||||||||||||||||||||||||||||||||||||||||||||||||||||||||||||||||||||||||||
 |
|
 |
||||||||||||||||||||||||||||||||||||||||||||||||||||||||||||||||||||||||||||||||||||||||||||||||||||||||||||||||||||||||||||||||||||||||||||||||||||||||||||||||||||||||||||||||||||||||||||||||||||||||||||||||||||||||||||||||||||||||||||||||||||||||||||||||||||||||||||||||||||||||||||||||||||||||||||||||||||||||||||||||||||||||||||||||||||||||||||||
| Figure 26. January 2002 Source: website: 20020128_1mo.jpg |
Figure 46. January 2005 Source: website: 20050128_1mo.jpg, |
Figure 66. January 2006 Source: website: 20060128_1mo.jpg |
| Reference Sites |
|
Erin 2001 wind analyses
http://www.aoml.noaa.gov/hrd/Storm_pages/erin2001/wind.html, (archived) Background on the HRD Surface Wind Analysis System http://www.aoml.noaa.gov/hrd/Storm_pages/surf_background.html, (archived) Hurricane Erin 2001 http://www.aoml.noaa.gov/hrd/Storm_pages/erin2001/, (archived) NASA Makes A Heated 3-D Look Into Hurricane Erin's Eye http://www.sciencedaily.com/releases/2005/10/051007090048.htm, (archived) Images and Data from Terra http://terra.nasa.gov/Gallery/ Images http://modis-atmos.gsfc.nasa.gov/IMAGES/index.html , (archived) |
|
Shortcut links
|
|
Jump to Magnetic Anomalies on 9/11/2001 Jump to Magnetometer Readings (normalized) (14 hours) Jump to Magnetometer Readings (normalized) (36 hours) Jump to Magnetometer Readings (normalized) (96 hours = 4 days) Jump to xxxx |
|
Continue to next page.
|
| Top | homepage |
|
|
|
|
|
|
|
|
|